
Diagnosing a MongoDB issue
You might have read a recent post by our developers concerning performance analysis tools and its follow up concerning sysdig. In the database world these tools come handy almost everyday. In this blog post I will show you a case where I have put tools to action diagnosing a MongoDB issue.
The case #
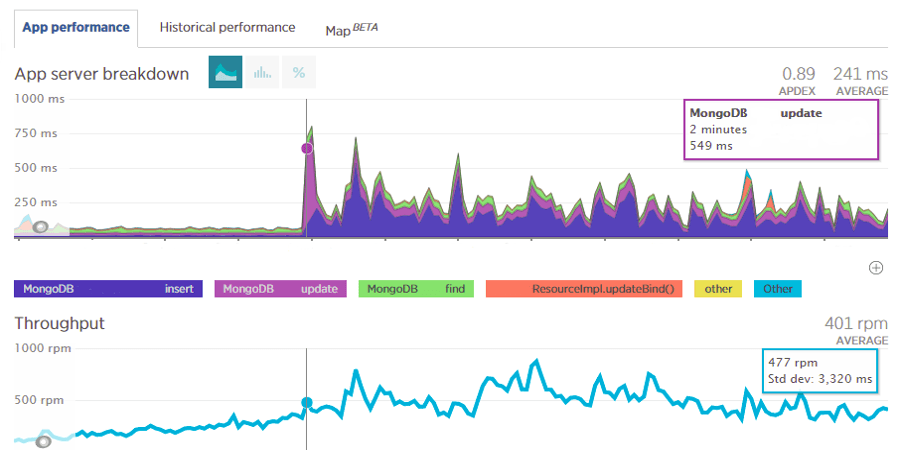
Some time ago we were alarmed by one of our scrum teams that MongoDB response time had jumped sky high. The New Relic screens were undeniable.
Environment #
MongoDB environment in question is a shared cluster. It currently comprises four shards. Each shard is a three node replica set. The design assumes one physical host in one data center, one physical host in another. Third member of the set is a cloud machine spawned in an openstack private cloud. This member is by definition weaker in terms of performance capabilities and system resources than the physical nodes. It is used to form a quorum and to keep a third data copy, just in case. It also has priority set to zero so that it is never promoted to primary.
Analysis #
Since the issue concerned data modification the natural way was to check primary first for any global issues. This is where tools mentioned earlier came in handy:
topshowed negligible load on the server,iostatshowed just a few percent utilization of our SSDs,vmstatshowed no swap activity.
It was safe to conclude the issue was not caused by an insufficient hardware resources.
Why did simple modification take so long then? I learned the application sets write concern to replica acknowledged. That implies next two areas of analysis:
- network issue,
- replica set issue.
I was inclined to believe it was a network issue. This is due to an outage we had experienced
a few days before. It had caused severe degradation of network performance,
as well as connectivity issues. Hopefully, there is an easy way to check it.
Simple test using ping utility showed stable and expected value for RTT (Round Trip Time).
It is worth to mention the importance of the RTT when building large scale, multi-datacenter applications with OLTP (Online Transaction Processing) characteristics. This value affects every operation connected with database interaction. In MongoDB due to implemented semantics of write concern the relationship is even tighter. Every operation changing data state will be delayed. The bigger the RTT the bigger the delay.
So, network was doing great. That left only one suspect which was replica set state itself. A quick check showed no clue:
# physical-node-2.dc4:
db3-rs0:PRIMARY> db.printSlaveReplicationInfo()
source: cloud-node.dc4:27317
    syncedTo: Xxx Yyy DD YYYY HH:MI:53 GMT+0100 (CET)
    2 secs (0 hrs) behind the primary
source: physical-node-1.dc5:27317
    syncedTo: Xxx Yyy DD YYYY HH:MI:52 GMT+0100 (CET)
    0 secs (0 hrs) behind the primary
Cloud node was a bit behind but physical node was up to date. This is what I would expect given our environment. The Replica acknowledged write concern requires confirmation from any secondary. So, one lagging secondary should not be an issue. However, as stated in the documentation, this data may not represent current state.
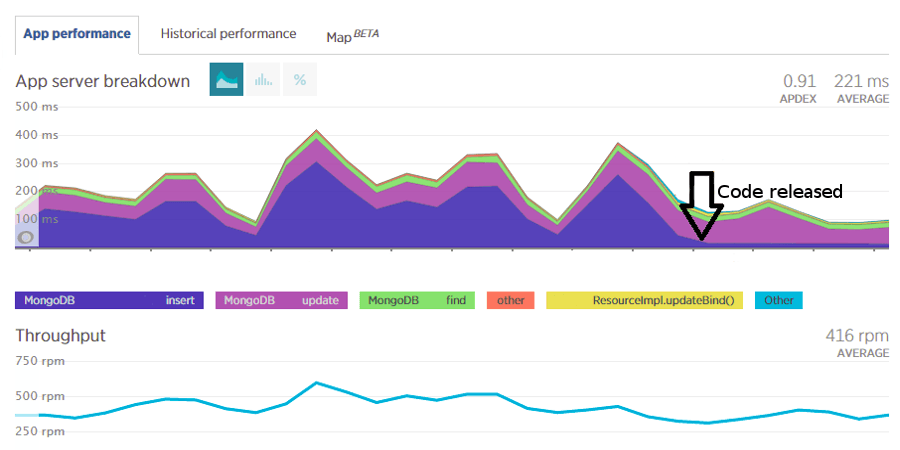
To make sure the issue was connected with replication itself a code fix changing write concern configuration from replica acknowledged to acknowledged was applied. The results were obvious.
So the replication was to blame. Great, but where was the root cause?
Some time later it hit me. The answer is below in rs.status() output. Observe the value of the syncingTo attribute.
db3-rs0:PRIMARY> rs.status()
{
    "set" : "db3-rs0",
    "date" : ISODate("YYYY-MM-DDTHH:MI:36Z"),
    "myState" : 1,
    "members" : [
        {
            "_id" : 1,
            "name" : "physical-node-2.dc4:27317",
            "health" : 1,
            "state" : 1,
            "stateStr" : "PRIMARY",
            "uptime" : 12532826,
            "optime" : Timestamp(*******776, 6),
            "optimeDate" : ISODate("YYYY-MM-DDTHH:MI:36Z"),
            "electionTime" : Timestamp(******2280, 1),
            "electionDate" : ISODate("YYYY-MM-DDTHH:MI:20Z"),
            "self" : true
        },
        {
            "_id" : 2,
            "name" : "cloud-node.dc4:27317",
            "health" : 1,
            "state" : 2,
            "stateStr" : "SECONDARY",
            "uptime" : 1700830,
            "optime" : Timestamp(*******776, 3),
            "optimeDate" : ISODate("YYYY-MM-DDTHH:MI:36Z"),
            "lastHeartbeat" : ISODate("YYYY-MM-DDTHH:MI:36Z"),
            "lastHeartbeatRecv" : ISODate("YYYY-MM-DDTHH:MI:35Z"),
            "pingMs" : 0,
            "syncingTo" : "physical-node-2.dc4:27317"
        },
        {
            "_id" : 3,
            "name" : "physical-node-1.dc5:27317",
            "health" : 1,
            "state" : 2,
            "stateStr" : "SECONDARY",
            "uptime" : 966374,
            "optime" : Timestamp(*******775, 1),
            "optimeDate" : ISODate("YYYY-MM-DDTHH:MI:35Z"),
            "lastHeartbeat" : ISODate("YYYY-MM-DDTHH:MI:35Z"),
            "lastHeartbeatRecv" : ISODate("YYYY-MM-DDTHH:MI:34Z"),
            "pingMs" : 8,
            "syncingTo" : "cloud-node.dc4:27317"
        }
    ],
    "ok" : 1
}
Replica set formed a chain: physical primary, cloud secondary, physical secondary.
This way physical-node-1.dc5 did not get a chance to confirm write since it was
syncing to a lagging cloud-node.dc4
This is how chained replication, a feature designed to offload the primary triggered a problem in our environment.
To permanently address the issue I followed documentation and disabled chained replication.
c = rs.config()
c.settings = {} # see docs note
c.settings.chainingAllowed = false
rs.reconfig(c)
In case you already have chained replication you will have to restart mongod process for an immediate effect.
Final note #
That day I learned yet another lesson. Please, keep in mind that for every feature there is a side effect. It may hit you by surprise, anytime.