
Digging into the system
This post is an introduction to sysdig — an “open source, system-level exploration” tool that ease the task of performance troubleshooting in Linux operating system.
The Box #
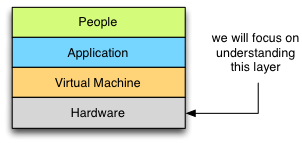
When it comes to understanding performance characteristics of applications I use a method called “The Box” introduced to me by Kirk Pepperdine during Java Performance Workshop. Box itself is an abstraction of the complete system and a systematic method which can be used to find performance bottlenecks:
Kirk states:
The final layer in the box is Hardware. This is a static layer that has a finite capacity. The CPU can only process so many instructions per second, memory can only hold so much data, I/O channels are limited data transfer rates, disks have a fixed capacity. It hardly needs to be said that if you don’t have enough capacity in your hardware, your application’s performance will suffer. Given the direct impact that hardware has on performance, all investigations must start here.
Our main task, when investigating this layer is to understand what and how shared hardware resources are used by our application. Given this knowledge we can move up “the box” understanding how each next layer utilises resources and what impact it has on overall performance as seen by the end user.
If you are familiar with Brendan Gregg’s Linux Observability Tools diagram (presented below), you can clearly see that tool selection under Linux operating system is overwhelming.
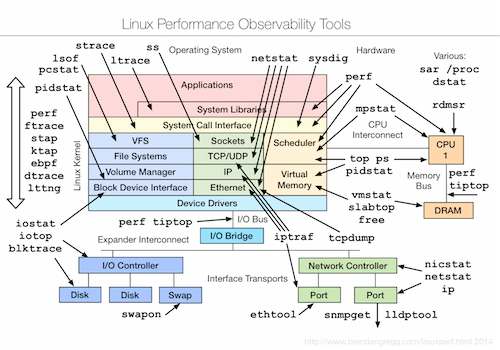
Most of them require extensive knowledge on system internals, how to use them and how to read the results. These are exactly the reasons why I think sysdig is a great tool for everyone involved in performance troubleshooting: it’s flexible, extensible and extremely easy to learn.
In the next couple of sections I will try to convince you to the above statement showing you how sysdig works on the kernel level, what capabilities it has and how you can leverage its power in everyday work.
System calls #
Before going further, it is crucial to explain what a system call is and how the usage of system calls affects performance. According to Wikipedia a system call can be defined as follows:
In computing, a system call is how a program requests a service from an operating system’s kernel. This may include hardware-related services (for example, accessing a hard disk drive), creation and execution of new processes, and communication with integral kernel services such as process scheduling. System calls provide an essential interface between a process and the operating system.
System calls were implemented to provide a proper security model where user and kernel spaces are separated. Basically spaces have different access levels due to the mechanism of protection rings implemented in CPUs. Thus programs run in their own address space and direct hardware access is prohibited.
Basically every operation involving I/O (hard disk access, networking or working with any other device), managing processes or threads, scheduling and memory allocation, goes through the system call facility. Understanding application behaviour on that level gives us intrinsic knowledge on what hardware resources are consumed and where bottlenecks occur.
You can read more about system calls and how they are implemented in Linux in following sources:
For the complete list of system calls please refer either to man, linux syscall reference or system call quick reference.
Tracepoints #
Sysdig makes use of a kernel facility called tracepoints introduced in kernel version 2.6.28 (released December 2008).
This mechanism allows developers to attach probes to specific functions inside the kernel. List of all tracepoints that
are traceable can be found using command perf list 'syscalls:*'. Output should be similiar to following one:
  syscalls:sys_enter_socket                          [Tracepoint event]
  syscalls:sys_exit_socket                           [Tracepoint event]
  syscalls:sys_enter_socketpair                      [Tracepoint event]
  syscalls:sys_exit_socketpair                       [Tracepoint event]
  syscalls:sys_enter_bind                            [Tracepoint event]
  syscalls:sys_exit_bind                             [Tracepoint event]
  syscalls:sys_enter_listen                          [Tracepoint event]
  syscalls:sys_exit_listen                           [Tracepoint event]
  syscalls:sys_enter_accept4                         [Tracepoint event]
  syscalls:sys_exit_accept4                          [Tracepoint event]
  syscalls:sys_enter_accept                          [Tracepoint event]
  syscalls:sys_exit_accept                           [Tracepoint event]
  ...
As you can see, tracepoints allow capturing system call entry and exit points so the processing time on the kernel side can be determined (let’s call it latency). There are many more tracepoints beside syscalls but they are not captured by sysdig as of version 0.1.93 so we will not cover them here (you can always play with perf tool and get every possible piece of information directly from the kernel).
Sysdig architecture #
 .
.
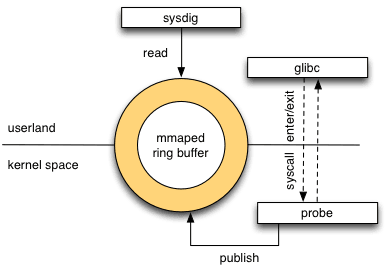
Sysdig consists of three main parts:
- memory mapped ring buffer shared between user and kernel spaces,
- kernel module called sysdig_probe that is responsible for publishing captured events into the ring,
- sysdig client tool that reads, filters and processes published events.
This straightforward architecture enables sysdig’s low overhead way of tracing system calls and scheduling events on the kernel side as kernel module itself is only responsible on copying events details (please note that probe will halt kernel execution so having less work to do will yield greater throughput). Most of the work is then done in the user space where events are read from ring buffer, decoded, filtered, processed in anyway and displayed to the user.
Using sysdig #
As we get through this boring introduction it is time to play with sysdig and unleash its power.
Installation is quite easy and involves issuing single command as root:
curl -s https://s3.amazonaws.com/download.draios.com/stable/install-sysdig | sudo bash
When the installation succeeded you will note that kernel module is loaded and ring buffer is ready:
~# lsmod  | grep sysdig
sysdig_probe          284918  0

~# dmesg | grep sysdig
[32171182.999973] sysdig_probe: driver loading
[32171182.999978] sysdig_probe: initializing ring buffer for CPU 0
[32171183.001607] sysdig_probe: CPU buffer initialized, size=1048576
Now we are ready to run sysdig command (example #1):
~# sysdig -v
7 22:20:02.830230658 0 sysdig (5031) > sysdigevent event_type=1 event_data=0
12 22:20:02.830350158 0 sysdig (5031) > switch next=0 pgft_maj=0 pgft_min=1071 vm_size=28888 vm_rss=3096 vm_swap=0
13 22:20:02.842437410 0 <NA> (0) > switch next=7 pgft_maj=0 pgft_min=0 vm_size=0 vm_rss=0 vm_swap=0
14 22:20:02.842459394 0 <NA> (7) > switch next=8 pgft_maj=0 pgft_min=0 vm_size=0 vm_rss=0 vm_swap=0
15 22:20:02.842498232 0 <NA> (8) > switch next=7 pgft_maj=0 pgft_min=0 vm_size=0 vm_rss=0 vm_swap=0
16 22:20:02.842509552 0 <NA> (7) > switch next=0 pgft_maj=0 pgft_min=0 vm_size=0 vm_rss=0 vm_swap=0
17 22:20:02.844132131 0 <NA> (0) > switch next=7 pgft_maj=0 pgft_min=0 vm_size=0 vm_rss=0 vm_swap=0
18 22:20:02.844139664 0 <NA> (7) > switch next=8 pgft_maj=0 pgft_min=0 vm_size=0 vm_rss=0 vm_swap=0
19 22:20:02.844152322 0 <NA> (8) > switch next=0 pgft_maj=0 pgft_min=0 vm_size=0 vm_rss=0 vm_swap=0
20 22:20:02.860451395 0 <NA> (0) > switch next=5031(sysdig) pgft_maj=0 pgft_min=0 vm_size=0 vm_rss=0 vm_swap=0

...
thousands of lines omitted :)
...
Driver Events:199904
Driver Drops:175222
Elapsed time: 0.291, Captured Events: 9095, 31256.98 eps
As you can see from the summary (printed when using verbose flag: -v) we have captured 9095 events during 0.2 s
run on a system that basically does nothing (ssh is running).
Understanding output #
Now let’s decipher meaning of each column in a line (example #2):
3 22:33:58.835496768 0 sshd (978) < accept fd=5(<4t>89.70.xx.xxx:52590->172.31.xx.xxx:22)
tuple=89.70.xx.xxx:52590->172.31.xx.xxx:22 queuepct=0
Fields have following meaning:
- Next event number (sequential)
- Event date
- CPU number (ID)
- Process name
- Thread ID (as seen by the operating system)
- Event direction
- > means entering call,
- < means leaving it
- Event type
- Event details (arguments)
As you can clearly see from the example #2 above sshd have accepted new incoming connection on a socket from address 89.70.xx.xxx.
You probably have not noticed in the example #1 that event numbering is not contiguous: this comes from the fact that
sysdig filters out events coming from itself. If you want to capture all events just use -D debug flag.
Then you should definitely notice huge number of Driver drops in the example #1. As it turns out sysdig kernel module is clever enough to drop events when the ring buffer is full and client is not able to keep up. Thanks to that there is no danger of a sudden system slow down which makes sysdig suitable for production usage.
Capturing and reading events #
Instead of displaying events to the console (which causes high number of Driver drops as formatting and writing output takes small but significant amount of time) we will capture them, write to the disk and analyze later (this is perfect for offline analysis in case of an emergency):
~# sysdig -vDw filename
^C
Driver Events:16709
Driver Drops:8
Elapsed time: 0.054, Captured Events: 16640, 308674.04 eps
Now as you can see number of drops is significantly lower and most of the events were captured.
Reading captured events is also trivial:
sysdig -vDr filename

16640 lines omitted...

Driver Events:0
Driver Drops:0
Elapsed time: 0.547, Captured Events: 16640, 30402.69 eps
We have captured, wrote and read back exactly the same number of events - this is actually pretty good sign.
Filtering the data #
Most of the programs rely on system resources heavily (thus doing a lot of system calls) and the number of events sysdig is able to capture is overwhelming - reading it line by line would be cumbersome task.
Here comes great usability of sysdig: its filtering capabilities. Sysdig allows you to filter on fields using number
of comparison operators: =, !=, <, <=, >, >=, contains and logical ones: and, or, not.
If you wonder what fields are associated with each generic event you should definitely run sysdig -l and for the
list of event types and their arguments (evt.args) sysdig -L.
Having this knowledge let’s try something simple and find out if someone has tried to connect to our sshd (we will filter event using process name, event type and event direction over previously collected trace file):
~# sysdig -vDr filename  "proc.name=sshd and evt.type=accept and evt.dir=<"

10175 23:12:21.735793105 0 sshd (978) < accept fd=5(<4t>62.210.xxx.xxx:48012->172.31.xx.xxx:22)
tuple=62.210.xxx.xxx:48012->172.31.xx.xxx:22 queuepct=0
15693 23:12:28.195257136 0 sshd (978) < accept fd=5(<4t>62.210.xxx.xxx:41037->172.31.xx.xxx:22)
tuple=62.210.xxx.xxx:41037->172.31.xx.xxx:22 queuepct=0
By accident I just discovered that someone has tried to log into my AWS instance.
Let’s try to see what login and password he or she has tried:
~# sysdig -AvDr filename  "proc.name=sshd and evt.type=read and fd.num=6 and evt.dir=<"

10798 23:12:21.744631009 0 sshd (5826) < read res=9 data=
root
...
10800 23:12:21.744639444 0 sshd (5826) < read res=12 data=
walters
...
16326 23:12:28.203841312 0 sshd (5828) < read res=14 data=
walters123
...
16328 23:12:28.203850357 0 sshd (5828) < read res=11 data=
vortal
Busted! Someone is trying to brute-force my root account (so sad it’s disabled) using dictionary passwords. Nice try but I’m not using password-based authentication unfortunately ;)
Beyond filtering #
So far we have seen only very basic filtering capabilities. Let’s move on to more complex examples and format some output.
As an example we will dump list of files read by nginx on my private server.
First of all let’s create a trace file:
~# sysdig -s 65536 -vSzw nginx.scap "proc.name=nginx"

Driver Events:11591
Driver Drops:0
Elapsed time: 0.051, Captured Events: 2975, 58753.83 eps
----------------------
Event           #Calls
----------------------
...
some stats omitted
...
< stat            12
> stat            12
> pread           10
< pread           10
< fstat           9
> writev          9
> open            9
< open            9
> close           9
< close           9
...
Notice that I’m using -z flag so that trace file will be compressed and I’m also prefiltering data so only events
related to nginx process will be captured. -s flag determines how many bytes of buffer will be captured on I/O
events (like reading from or writing to file).
In this example I’m particularly interested in open syscall to see what files have been “touched” by web server and how many times. I would like also to export directory of the file, its name and event timestamp in JSON format. Here is how it can be achieved:
sysdig -r nginx.scap -j -p "%evt.time %fd.directory %fd.filename" "evt.type=open and evt.dir=<"

[{"evt.time":1422296764524287386,"fd.directory":"/var/www/site/","fd.filename":"index.html"},
{"evt.time":1422296764630046088,"fd.directory":"/var/www/site/assets/css/","fd.filename":"combined.min.css"},
{"evt.time":1422296764631384411,"fd.directory":"/var/www/site/assets/js/","fd.filename":"jquery-1.10.2.min.js"},
{"evt.time":1422296764689983529,"fd.directory":"/var/www/site/assets/css/","fd.filename":"screen.css"},
{"evt.time":1422296764692816445,"fd.directory":"/var/www/site/assets/css/","fd.filename":"coderay.css"},
{"evt.time":1422296764693130208,"fd.directory":"/var/www/site/assets/css/","fd.filename":"main.css"},
{"evt.time":1422296764693301594,"fd.directory":"/var/www/site/assets/css/","fd.filename":"cookiecuttr.css"},
{"evt.time":1422296764745976746,"fd.directory":"/var/www/site/assets/css/","fd.filename":"normalize.css"},
{"evt.time":1422296765112198482,"fd.directory":"/var/www/site/assets/fonts/","fd.filename":"icons.woff"}]
That’s it - only single command with -j flag responsible for returning events in JSON format and -p
allowing you to select (or format) which fields will be a part of the output.
Given the powerful filtering and formatting syntax it’s extremely easy to analyze and understand behaviour of your applications.
But there is one more thing #
Unfortunately sometimes you will need to analyze not a single event but sequences of ordered events in a stateful manner. If you are familiar with dtrace you probably know that it supports writing event-based scripts. Analogue concept in sysdig is called chisel.
Chisels are small, reusable scripts written in Lua programming language and I can say that they are quite easy to write :)
Sysdig comes with a couple of useful chisels out of the box:
~# sysdig -cl

Category: CPU Usage
-------------------
topprocs_cpu        Top processes by CPU usage

Category: Errors
----------------
topfiles_errors     top files by number of errors
topprocs_errors     top processes by number of errors
...
You can execute them over generated trace or live data using -c flag:
~# sysdig -r nginx.scap -c iobytes_net
18:26:03 in:0 out:0 tot:0
18:26:04 in:0 out:0 tot:0
18:26:05 in:3371 out:42211 tot:4
Then to display more information about a chisel (and its arguments) -i flag can be used:
~# sysdig -i iobytes_net

Category: Net
-------------
iobytes_net         Show total network I/O bytes

counts the total bytes read from and written to the network, and prints the result every second
Args:
(None)
Lua syntax is powerful and easy to understand and chisel API consists of only handful of functions so writing chisels is quite pleasant task.
As a best recommendation I can share with you that it took me about an hour to write simple socket inactivity detector without prior knowledge and experience in writing chisels or Lua programming language. Cool, isn’t it?
Summary #
For me sysdig is great, easy to understand and use tool for online/offline, production profiling and analysis tasks. It comes with powerful filtering and formatting capabilities, very good documentation and growing community. Possibility of writing chisels allows both automation of commons tasks and performing complex, stateful analyses.
I would recommend using sysdig as a first choice while battling with application performance diagnosis.