Accelerate test execution in Groovy and Spock
In one of our core services, the execution of a single unit test took approximately 30 seconds, while a single integration test ranged between 65 and 70 seconds. Running the entire test suite took circa 6 minutes.
As software engineers, we run tests very frequently. The significance of an efficient feedback loop in our daily coding routine cannot be neglected. Rapid test execution provides immediate feedback on code changes, enabling developers to quickly identify and rectify issues.
This article focuses on strategies to shorten test execution time in a Groovy and Spock testing environment. It explores practical methods to optimize test performance, such as utilizing Groovy compilation avoidance, enabling incremental compilation, and leveraging hardware upgrades. By using these techniques, developers can significantly reduce the time it takes to run unit and integration tests, leading to a more efficient development process with quicker feedback loops.
Measuring task timings #
Overview of my benchmark project #
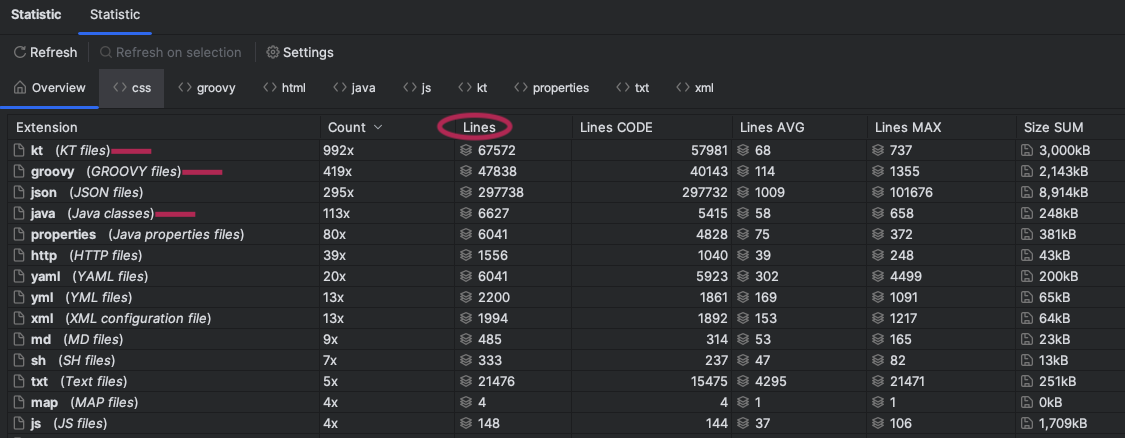
Source code lines (code + blank lines):
- Java — 6 627
- Kotlin — 67 572
- Groovy — 47 838
Stats were gathered by the Statistic plugin in IntelliJ.

The production code is written in Kotlin and Java with Spring Framework. The majority of the tests utilize Groovy and Spock, some of them are created with Kotest and Kotlin
Number of tests in this service:
- Unit tests — 3 585
- Integration tests — 859
Test runner configuration in IntelliJ #
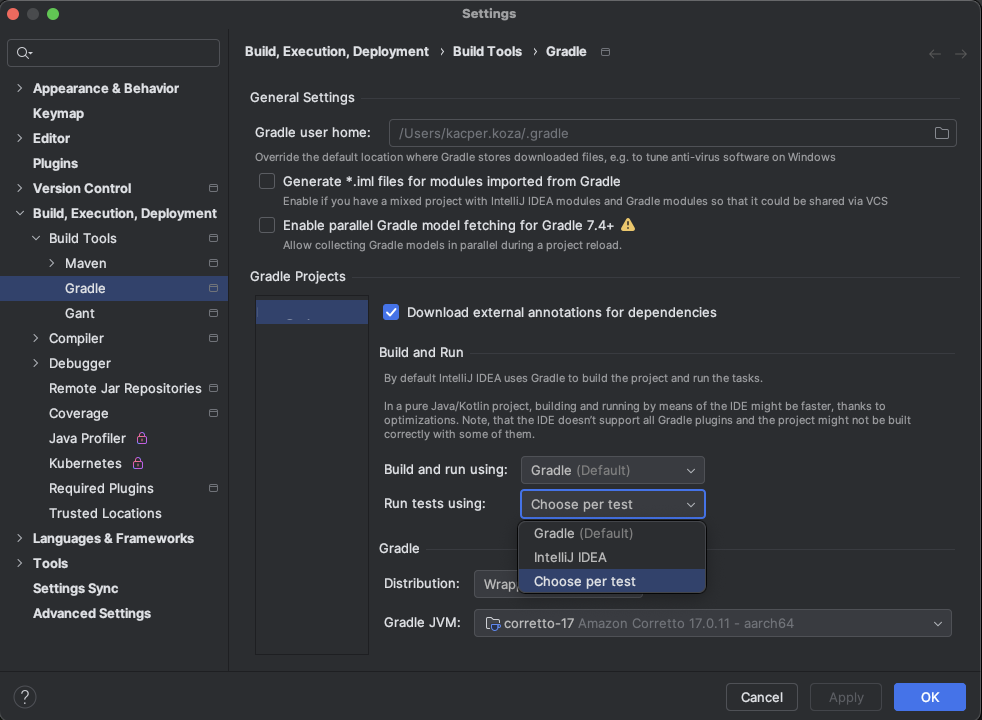
In a project that uses Gradle, like mine, to check what your runner is, open settings CMD + ,.
Navigate via Build, execution, deployment > Build tools > Gradle and check field Run tests using.

Measuring Gradle task timings #
To monitor tasks’ durations, append the following code at the end of your build.gradle.
Note that this script is tailored for Gradle 8.3 and may require adjustments for other versions.
gradle.addListener new TimingsListener()

import java.util.concurrent.TimeUnit

// Log timings per task.
class TimingsListener implements TaskExecutionListener, BuildListener {
private long startTime
private timings = []

    @Override
    void beforeExecute(Task task) {
        startTime = System.nanoTime()
    }

    @Override
    void afterExecute(Task task, TaskState taskState) {
        def ms = TimeUnit.MILLISECONDS.convert(System.nanoTime() - startTime, TimeUnit.NANOSECONDS);
        timings.add([ms, task.path])
        task.project.logger.warn "${task.path} took ${ms}ms"
    }

    @Override
    void buildFinished(BuildResult result) {
        println "Task timings:"
        for (timing in timings) {
            println "${timing[1]} - ${timing[0]}"
        }
        println("Tasks >1000ms")
        int totalElapsed = 0
        for (timing in timings) {
            totalElapsed += timing[0]
            if (timing[0] >= 1000) {
                printf "- %7s ms  %s\n", timing
            }
        }
        println("Total elapsed (all tasks) = " + (totalElapsed / 1000) + " seconds")
    }

    @Override
    void projectsEvaluated(Gradle gradle) {}

    @Override
    void projectsLoaded(Gradle gradle) {}

    @Override
    void settingsEvaluated(Settings settings) {}
}
Base timings for ./gradlew test. #
The way my project is configured, this command executes both integration and unit tests.
Results on my 2019 Macbook Pro with Intel CPU:
All tasks timings:

:checkKotlinGradlePluginConfigurationErrors - 0
:processResources - 3
:generateManifest - 2
:dependenciesFile - 4
:setupCommandLineIncludePatternsForTests - 0
:processTestResources - 9
:processIntegrationResources - 0
:kaptGenerateStubsKotlin - 4242
:kaptKotlin - 3044
:compileKotlin - 4404
:compileJava - 1749
:compileGroovy - 0
:classes - 0
:kaptGenerateStubsTestKotlin - 2633
:kaptTestKotlin - 2130
:compileTestKotlin - 1811
:compileTestJava - 1
:compileTestGroovy - 15311
:testClasses - 0
:unitTest - 71953
:kaptGenerateStubsIntegrationKotlin - 555
:kaptIntegrationKotlin - 959
:compileIntegrationKotlin - 1
:compileIntegrationJava - 0
:compileIntegrationGroovy - 10758
:integrationClasses - 0
:integrationTest - 190010
:checkPresenceOfMatchingTests - 0
:test - 0

Tasks >1000ms
- 4242 ms :kaptGenerateStubsKotlin
- 3044 ms :kaptKotlin
- 4404 ms :compileKotlin
- 1749 ms :compileJava
- 2633 ms :kaptGenerateStubsTestKotlin
- 2130 ms :kaptTestKotlin
- 1811 ms :compileTestKotlin
- 15311 ms :compileTestGroovy
- 71953 ms :unitTest
- 10758 ms :compileIntegrationGroovy
- 190010 ms :integrationTest

Total elapsed (all tasks) = 309.579 seconds
The worst result on my machine was 513 seconds (8.5 minutes). On average, after thermal CPU throttling, the whole test suite ended in 6 minutes. Check how to monitor thermal CPU throttling in OS X.
All the following listings will include only tasks that run for more than 1000 ms.
M3 Pro vs Intel #
Meanwhile, I’ve received a brand new Macbook M3 Pro. I decided to continue on M3 Pro because it took me much less time to run hundreds of tests after a small change.
Execution timings for Macbook M3 Pro:
Tasks >1000ms
- 6553 ms :compileTestGroovy
- 47199 ms :unitTest
- 4781 ms :compileIntegrationGroovy
- 111390 ms :integrationTest

Total elapsed (all tasks) = 170.287 seconds [Macbook Pro 2024 with M3 Pro]
Comparison: 170.287 seconds vs 309.579 seconds on Macbook Pro 2019 with Intel CPU
Without any code and configuration modifications, the M3 Pro completed the test suite about 45% faster than the Intel version, underscoring the benefits of investing in superior hardware.
Compilation avoidance for Groovy #
One effective way to accelerate testing could be achieved by incorporating compilation avoidance.
What is the compilation avoidance?
If a dependent project has changed in an ABI-compatible way (only its private API has changed), then Java compilation tasks will be up-to-date. This means that if project A depends on project B and a class in B is changed in an ABI-compatible way (typically, changing only the body of a method), then Gradle won’t recompile A.
Caveat: Groovy compilation avoidance is an incubating feature since Gradle 5.6. There are known inaccuracies so please enable it at your own risk. Some of the types of changes that do not affect the public API and are ignored:
- Changing a method body
- Changing a comment
- Adding, removing or changing private methods, fields, or inner classes
- Adding, removing or changing a resource
- Changing the name of jars or directories in the classpath
- Renaming a parameter
source:
Groovy compilation avoidance documentation
Unit test #
I started to run a single unit test, without any change in the source code and the test code:
Tasks >1000ms
- 6772 ms :compileTestGroovy
- 2479 ms :unitTest

Total elapsed (all tasks) = 9.496 seconds
compileTestGroovy takes the same amount of time for every run.
By adding
enableFeaturePreview('GROOVY_COMPILATION_AVOIDANCE')
to settings.gradle,
each subsequent run of the same unit test took less than 3 seconds:
Tasks >1000ms
- 2398 ms :unitTest

Total elapsed (all tasks) = 2.671 seconds
This change resulted in a 70% speed increase on the M3 Pro!
Integration test #
Results for a single integration test before and after enabling compilation avoidance:
Before:
Tasks >1000ms
- 7062 ms :compileTestGroovy
- 5084 ms :compileIntegrationGroovy
- 14478 ms :integrationTest

Total elapsed (all tasks) = 27.061 seconds
After:
Tasks >1000ms
- 14165 ms :integrationTest

Total elapsed (all tasks) = 14.535 seconds
Integration test on M3 Pro is about 45% faster now!
Compilation avoidance on Intel #
What does it look like on my Intel? Single unit test without compilation avoidance:
Tasks >1000ms
- 2351ms :compileTestGroovy
- 7025ms :unitTest

Total elapsed (all tasks) = 31.539 seconds [intel]
With compilation avoidance:
Tasks >1000ms
- 8168ms :unitTest

Total elapsed (all tasks) = 8.976 seconds [intel]
Compilation avoidance accelerated a single unit test by approximately 70% on Intel.
Single Integration test duration decreased from 70 seconds to 45 seconds, marking a 35% improvement.
Changing test source code — incremental compilation #
Back on the M3 Pro, modifying a line in the test Groovy sources resulted in:
Tasks >1000ms
- 7205 ms :compileTestGroovy
- 2767 ms :unitTest

Total elapsed (all tasks) = 10.257 seconds
Even if we change only a single line in one file, the whole source set will be recompiled. To avoid this, we can use incremental compilation.
By incorporating incremental compilation via build.gradle:
tasks.withType(GroovyCompile).configureEach {
    options.incremental = true
    options.incrementalAfterFailure = true
}
Single unit test after this change:
Tasks >1000ms
- 1374 ms :compileTestGroovy
- 2471 ms :unitTest

Total elapsed (all tasks) = 4.169 seconds
Again, the execution time was reduced by about 60%.
What is incremental compilation?
If only a small set of Groovy source files are changed, only the affected source files will be recompiled. Classes that don’t need to be recompiled remain unchanged in the output directory. For example, if you only change a few Groovy test classes, you don’t need to recompile all Groovy test source files — only the changed ones need to be recompiled.
To understand how incremental compilation works, see Incremental Java compilation for a detailed overview. Note that there’re several differences from Java incremental compilation:
Sources:
Groovy Incremental compilation
Compilation avoidance vs incremental compilation
Groovy incremental compilation known issues
Check your tests #
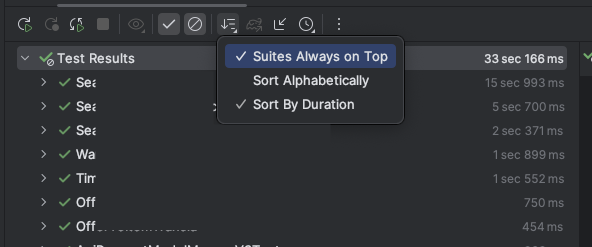
Reviewing test durations:

Sort your tests by duration to identify the most time-consuming ones. For instance, three classes with unit tests exceeding 20 seconds can significantly affect overall test time. These tests might have been designed improperly and may need some improvements
Tasks >1000ms
- 47987 ms :unitTest

Total elapsed (all tasks) = 48.257 seconds
In my analysis, I discovered tests incorporating retries and delays of 1000 milliseconds. The code was simulating requests to an external service, relying on the remaining allowed time and retries. Simplifying greatly, it looked as follows:
data class RequestConfig(
    val retries: Long,
    val timeout: Long
)

class ExampleService() {

    val config = RequestConfig(
        retries = 3L,
        timeout = 1000L
    )

    fun getSomething(): Mono<String> {
        return getData()
            .doOnError { // only for displaying time in the tests
                println("${it.message} ${currentTime()}")
            }
            .timeout(Duration.ofMillis(config.timeout))
            .retry(config.retries)
    }

    private fun getData(): Mono<String> {
        return Mono.fromSupplier { // simulate long-running operation, like HTTP request
            Thread.sleep(1000L)
            throw RuntimeException("runtime exception")
        }
    }
}
Here is a simplified test that demonstrates the issue:
def 'should get data'() {
    given:
    println "[TEST START] ${currentTime()}"
    ExampleService exampleService = new ExampleService()

    when:
    exampleService.getSomething().block()

    then:
    thrown(RuntimeException)
    println "[TEST END] ${currentTime()}"
    // verify retries and time budgets etc
}
The output for this test is as follows:
[TEST START] 10:04:00.501
runtime exception 10:04:01.637
runtime exception 10:04:02.652
runtime exception 10:04:03.659
runtime exception 10:04:04.666
[TEST END] 10:04:04.679
As shown, a single test consumes 4 seconds, and with multiple similar tests, the cumulative delay becomes problematic.
There are various strategies for testing scenarios involving time, delays, and retries. In our particular case, the challenge was compounded by logic that calculated the remaining time and ensured sticking to a defined “time budget”.
One simple way to optimize the example code above is by passing the RequestConfig via the constructor:
class ExampleService(
    private val config: RequestConfig
) {
    // ...
}
This approach allows for minimizing the number of retries and timeouts within the test itself:
def 'should get data'() {
    given:
    int retries = 2
    int timeout = 50
    RequestConfig config = new RequestConfig(retries, timeout)
    ExampleService exampleService = new ExampleService(config)

    // (...)
}
We reviewed our long-running tests based on timeouts and delays. After refactoring, the delays in these tests were significantly reduced, resulting in a 25-second reduction in overall execution time.
Tasks >1000ms
- 22993 ms :unitTest

Total elapsed (all tasks) = 23.274 seconds   // our base line was 48 seconds
Another way to test time-based publishers is by using StepVerifier.withVirtualTime, which enables testing delayed events without waiting for the actual delay to elapse.
Additional optimizations #
I discovered several resources on enhancing Gradle performance and Spring Boot tests optimization, although they didn’t bring significant improvements in my case. Nevertheless, they might prove useful.
Gradle #
Put the following parameters in the gradle.properties file (project’s root directory):
org.gradle.jvmargs=-Xmx3g (already present in my project)
org.gradle.caching=true (already present in my project)
org.gradle.daemon=true (dameon should be running by default)
Increase heap size
Enable build cache
Use Gradle daemon
Gradle is running on the JVM, keeping it in the latest version together with Java runtime may benefit in better performance.
Gradle performance documentation
Optimize the runtime of Spring Boot tests #
Tldr; Problematic @DirtiesContext, @ActiveProfiles, @MockBean, number of cached Spring contexts etc.
How to optimize the runtime of your Spring Boot integration tests
Spring Tests
IntelliJ Runner vs Gradle #
You can switch your test runner from Gradle to IntelliJ Runner. I checked both runners — for me there was no big difference in timings.
Conclusion #
While hardware upgrades like moving to an M3 Pro can offer immediate performance gains, some of the software optimizations could still ensure that your tests run more efficiently on any setup. By implementing strategies like Groovy compilation avoidance and incremental compilation, you can significantly reduce the time required to run your tests. Overall, we cut down the execution time of the entire test suite by over 50%, from 6 minutes to just under 3 minutes.
Given that TDD encourages frequent test runs, the impact of these optimizations becomes even more substantial. If you’re running the test suite several dozen times a day, these time savings add up quickly. For instance, running the test suite 20 times in a day with these improvements could save you an entire hour that would otherwise be spent waiting on test results.
With faster tests, you can focus on delivering quality software more efficiently, ultimately benefiting both your team and your end users.
