INP — what is the new Core Web Vitals metric and how do we work with it at Allegro.
Site performance is very important, first of all, from the perspective of users, who expect a good experience when visiting the site. The user should not wait too long for the page to load. We all know how annoying it can be when we want to press an element and it jumps to another place on the page or when we click on a button and then nothing happens for a very long time. The state of a site’s performance in these aspects is measured by Web Vitals performance metrics and most importantly by a set of three major Core Web Vitals metrics (LCP — Largest Contentful Paint, CLS — Cumulative Layout Shift, INP — Interaction to Next Paint). They are responsible for measuring the 3 things: loading time, visual stability and interactivity. These metrics are also important for the websites themselves because, in addition to the user experience, they are also taken into account in terms of the website’s positioning in search engines (SEO), which is crucial for most websites on the Internet, Allegro included.
In this post, you can read about INP — the new Core Web Vitals metric assessing overall responsiveness of the page which replaced FID (First Input Delay) as of March 12, 2024 (source).
What is INP? #
INP (Interaction to Next Paint) – is a new WebPerf metric that measures the overall responsiveness of the website to user interactions throughout the user’s visit to the page. INP value is the measured time from registering a user event to rendering a new frame in the browser. It uses Event Timing API under the hood. Good responsiveness of the website means that the browser presents “visual feedback” of the interaction as quickly as possible (more about the meaning of “visual feedback” in the context of the INP metric in the next section ;)) .
An interaction can be a single mouse click event or a group of events like a tap interaction (pointerup, pointerdown, and click).
At this point, INP only observes:
- Mouse clicks
- Tapping on the screen (on touchscreen devices)
- Keyboard interactions (physical or on-screen)
How is INP measured? #
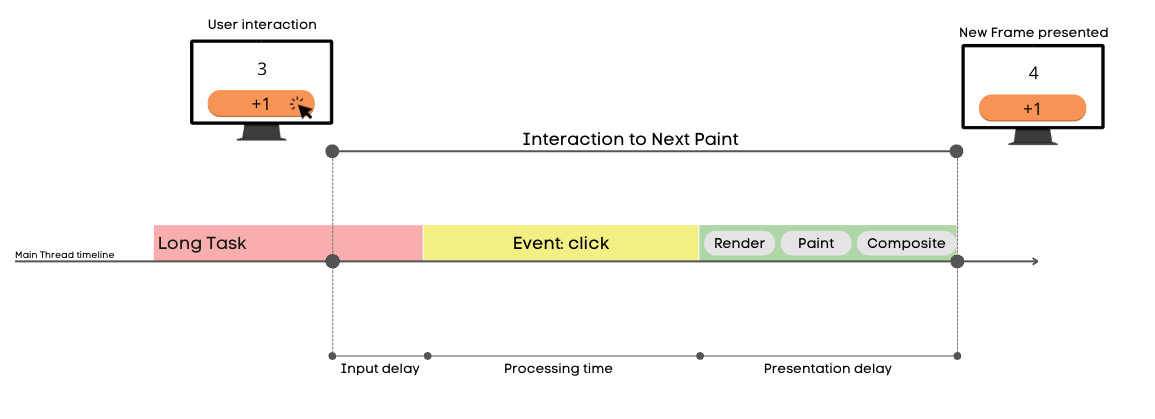
INP measures the time from detecting user input to presenting a new frame in the browser. This process has three phases:
- Input delay – delay from detecting user’s interaction to calling event callback
- Processing time – calling code with event handlers
- Presentation delay – presenting new frame by the browser (render, paint, compositing)
Where can you look for improvements? First of all, in phases one and two.
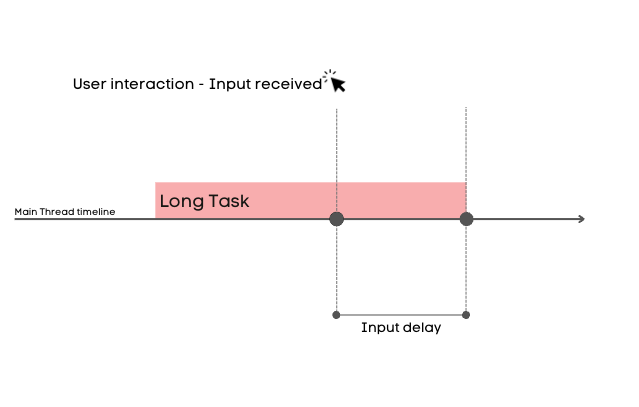
- Input delay phase – the interaction can happen anytime during the user’s visit. The main thread in the browser
may be busy at this time because of some already ongoing task. This situation can increase how long
this phase lasts. Blocked main thread = longer time to call the event callback.
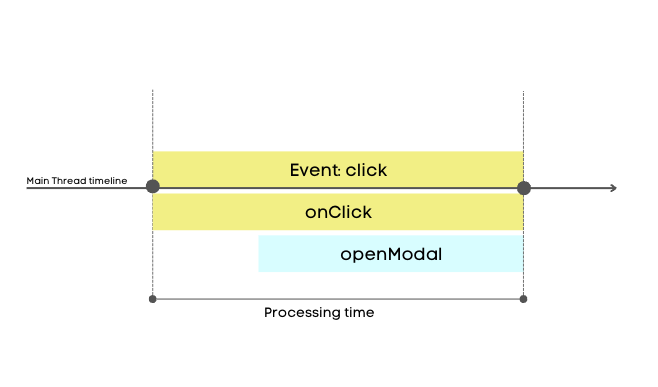
- Processing time – it is the time when event callbacks with the engineer’s code that handles user interaction are executed
(
onClick,onKey). It is crucial not to block the main thread for too long with the code that handles interactions.
How is the final INP value of the visit calculated? #
Up to this point the article was focused only on INP values for single interactions. As mentioned INP is measured for the entire user visit. It is possible to find various information on how the final INP value is calculated.
Web.dev informs:
- For visits with few interactions (<=50): INP is the highest measured value during the visit
- For visits with large numbers of interactions (>50): the highest value for every 50 interactions is ignored. Next INP is the highest value from the remaining measurements.
DebugBear.com informs that INP is reporting 98 percentile of all measured interactions.
Example 1: if the visit had 100 interactions with 50ms and two with 300ms: 50 ms will be reported
Example 2: if on the same visit there were 3 interactions with 300ms then it will report 300ms
Important! #
- An important aspect to understand is that “presenting visual feedback” does not have to mean a noticeable visual effect for the user. Some interactions do not give the user any visual feedback of the interaction and such interactions also report its INP value. The INP metric only measures the time to completion of the rendering (presenting a new frame) process (even if visually nothing has changed for the user)! For example, a button element that triggers an HTTP request may not display any visual feedback, such as a spinner animation, but the browser will still report the INP as soon as the next frame is rendered.
- What about long animations? – For example: if an animation, which is the visual effect of some interaction, lasts 400ms, it does not mean that our INP value will be increased by the duration of the animation. CSS-based animations, and Web Animations (in the browser that supports the API) are handled on a thread known as the “compositor thread” and do not block the main thread.
- If the interaction handling requires fetching/requesting some external resources (like executing an HTTP request), then the time of handling such operation is not included in the INP value. It is because operations like this are asynchronous and handling the result of such operations is being performed in other tasks.
What is a good INP value? #
The sum of Input Delay time, Processing Time and Presentation Delay phases is the final INP value for the interaction. Google set three threshold ranges (source):
- Good: <= 200ms
- Needs Improvement: > 200ms and <= 500ms
- Poor: > 500ms

Why is it important to stay below recommended thresholds? #
Core Web Vitals is a set of the most important performance metrics that determine overall evaluation of “Page Experience” on three different criteria:
- Loading — Largest Contentful Paint metric (LCP)
- Visual stability — Cumulative Layout Shift metric (CLS)
- Interactivity — Interaction to Next Paint (INP) — On March 12, 2024 INP officially replaced FID and took over the role of the Interactivity metric in the Core Web Vitals (CWV) set
All Core Web Vitals are scored based on their performance in the field at the 75th percentile of all page loads. Google collects data from real users (Real User Monitoring – RUM).
In search ranking, sites are evaluated as individual URLs. For example, this means that in this aspect
the two addresses allegro.pl/oferta/offer-1 and allegro.pl/oferta/offer-2 are rated separately.
Google doesn’t share the exact data on how their ranking algorithm works, but what is clear is that the overall “Page Experience” determined by Core Web Vitals has an important impact on how each website URL is ranked in search results. Because of that it is best to stay in the “good” rating thresholds for all the Core Web Vitals metrics not to be affected in any negative way.
INP vs FID #
Previously (until March 12, 2024) the role of the metric that determined a page’s responsiveness to user’s interactions in the Core Web Vitals set was the FID metric. Both metrics evaluate the user’s perception of an application’s responsiveness. As the name suggests, FID (First Input Delay) measures the delay of processing only for the first user interaction (input). It is not the only difference because FID does it in a different way. Unlike INP, it measures the time from detecting a user interaction to the start of its processing. FID relates only to the first of the three phases described above (Input delay).

Key information summary: #
| FID | INP |
|---|---|
| Only first interaction | All users’ interactions during the visit |
| Delay from registering an event to start of processing (input delay) | Time from registering an event to rendering visual effect (input delay + processing + presenting) |
| Result is defined in milliseconds (ms) | Result is defined in milliseconds (ms) |
| Determines the speed at which the site is ready for interaction | Determines overall page responsiveness |
INP — debugging #
1. Using RUM data to find slow interactions #
If there is such a possibility, the best way to start a debugging journey is to analyze data collected directly from users (known as RUM – Real User Monitoring). For INP, such data can provide information about which element was interacted with and the INP time values in all three phases. This can be crucial for finding specific elements on a page that are most frequently interacted with by users and which interactions are reported to be long (>200ms). Data like this may differ from those collected manually or collected during synthetic testing, due to hardware differences in users’ end devices.
2. Measuring time of a single interaction with Google Chrome extension — web-vitals. #
In addition to other helpful information about Web Vitals, this extension gives us measurement results for single interactions with a distinction for all 3 phases. After turning on the right option in the extension settings, you can find the metric logs in developer tools in the “Console” tab.
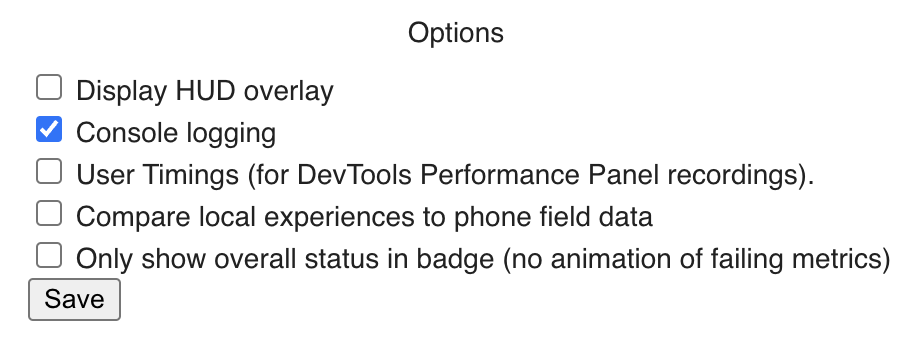
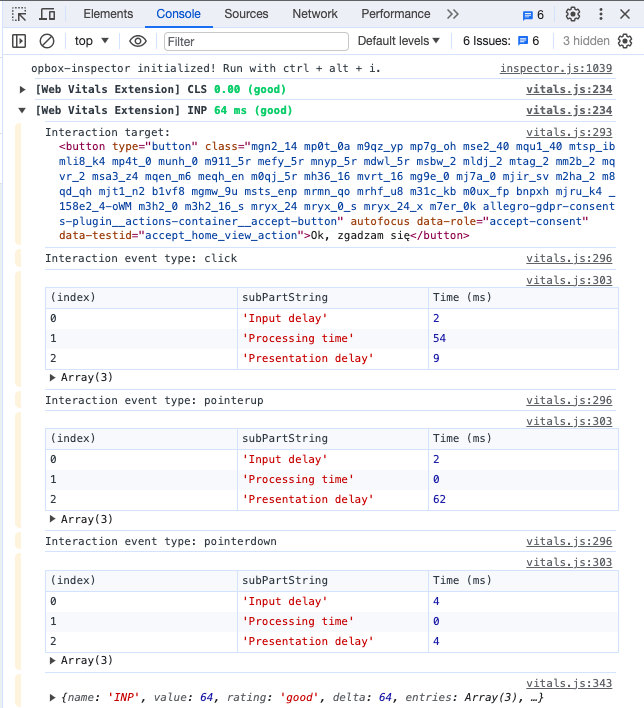
Web-vitals Chrome extension can be found HERE.
3. JavaScript snippet #
If you can’t use web-vitals Chrome extension, you can use this JS snippet:
let worstInp = 0;

const observer = new PerformanceObserver((list, obs, options) => {
  for (let entry of list.getEntries()) {
    if (!entry.interactionId) continue;

    entry.renderTime = entry.startTime + entry.duration;
    worstInp = Math.max(entry.duration, worstInp);

    console.log('[Interaction]', entry.duration, `type: ${entry.name} interactionCount: ${performance.interactionCount}, worstInp: ${worstInp}`, entry, options);
  }
});

observer.observe({
  type: 'event',
  durationThreshold: 0, // 16 milliseconds minimum by the spec
  buffered: true
});
4. “Performance” section in developer tools in the browser #
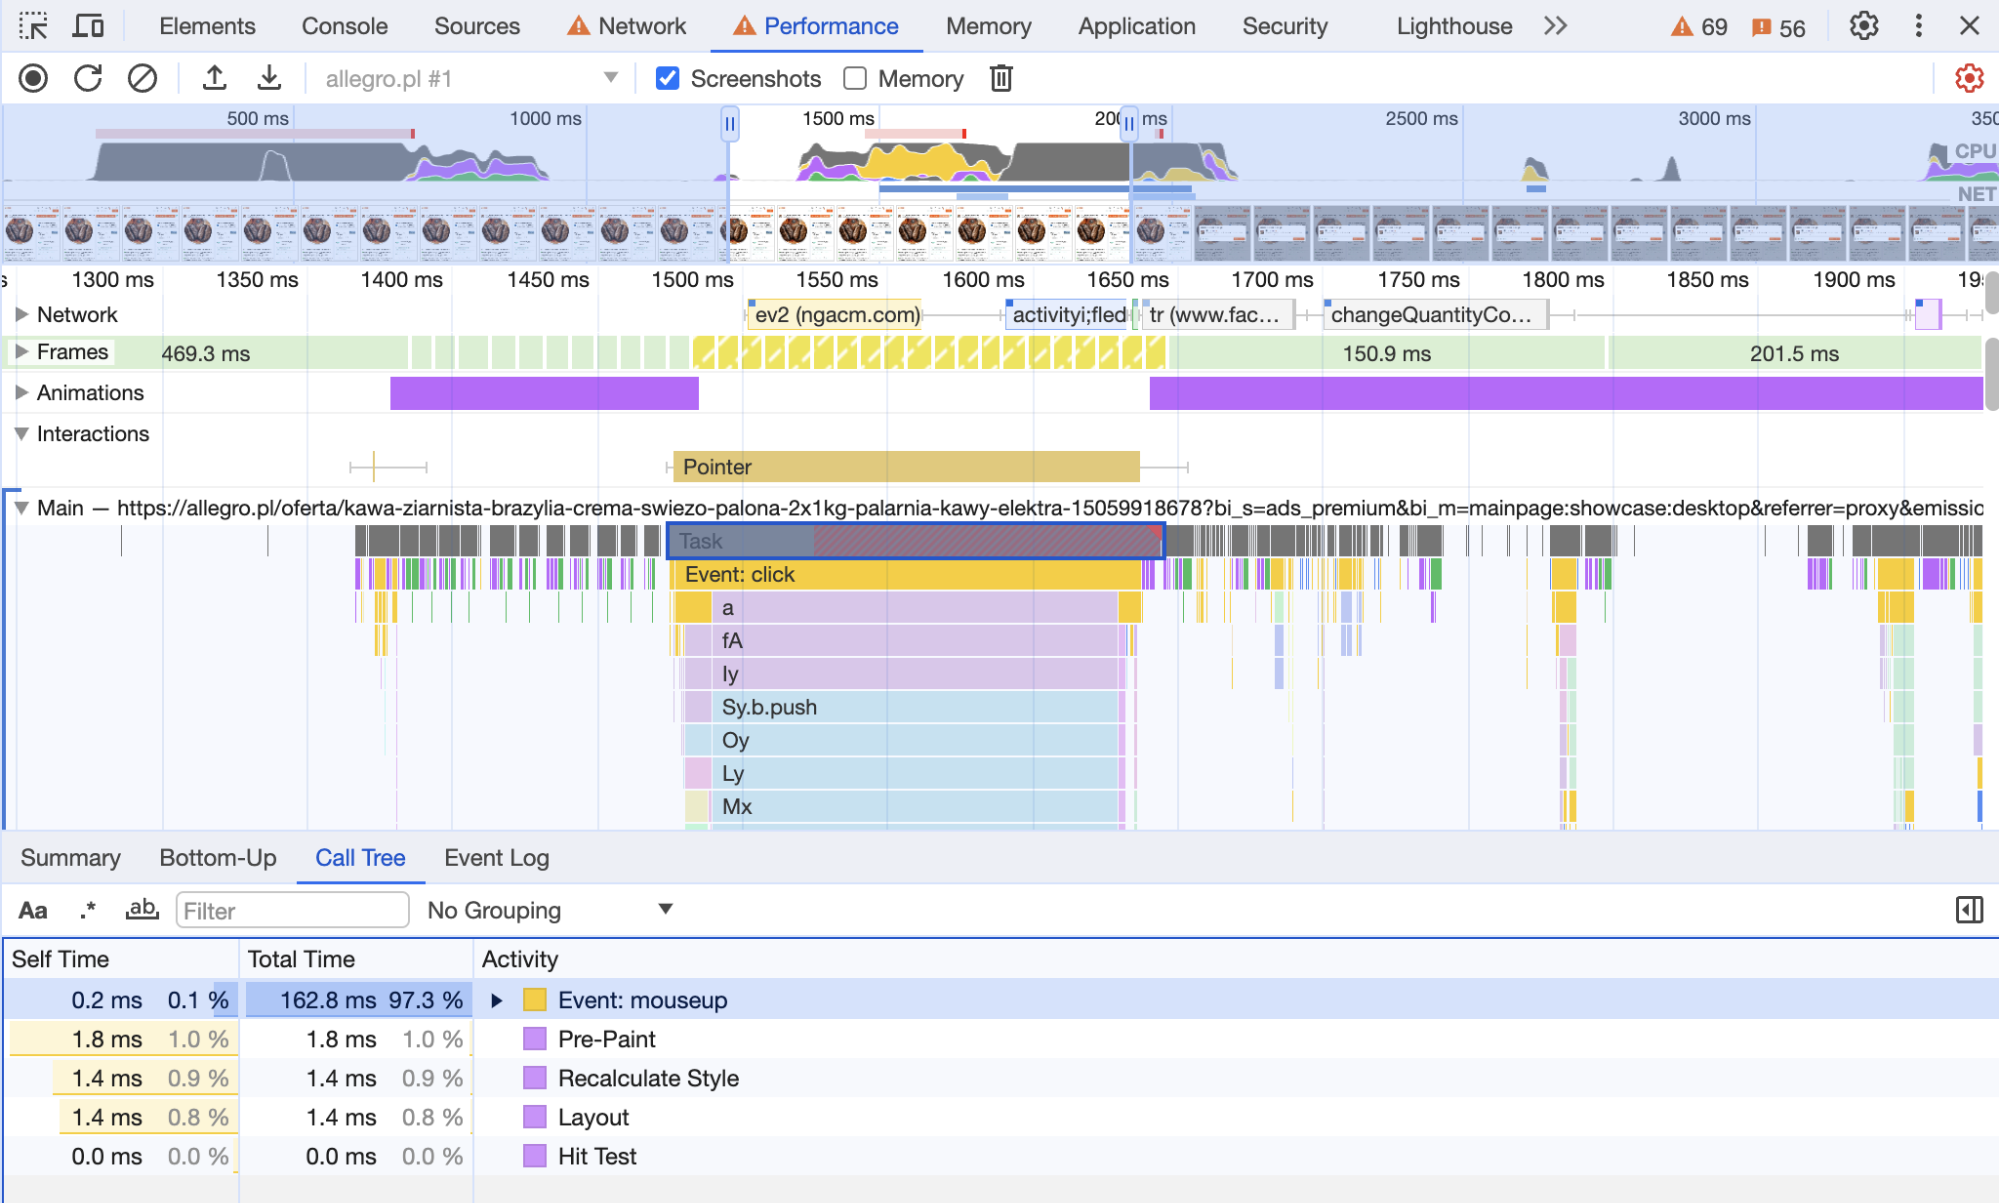
The “performance” section with its recording option can provide all the necessary information about what is happening in the browser and in the main thread. It also allows you to detect long tasks, check the exact call stack in any recorded moment, rendered frames, cyclic and synchronous style recalculations and more. It can be your best friend during debugging a slow interaction :)


5. Synthetic tests tools #
- PageSpeed Insights (Web App tool): https://pagespeed.web.dev/
- INP debugger (Web App tool): https://www.debugbear.com/inp-debugger
6. Other helpful tips #
- Use CPU throttling during debugging the interaction - some INP issues can be noticeable only on slower devices.
- You can turn it on in the developers tools → “Performance” tab settings → CPU
- Local overrides - you can override script locally (more info: https://developer.chrome.com/docs/devtools/overrides)
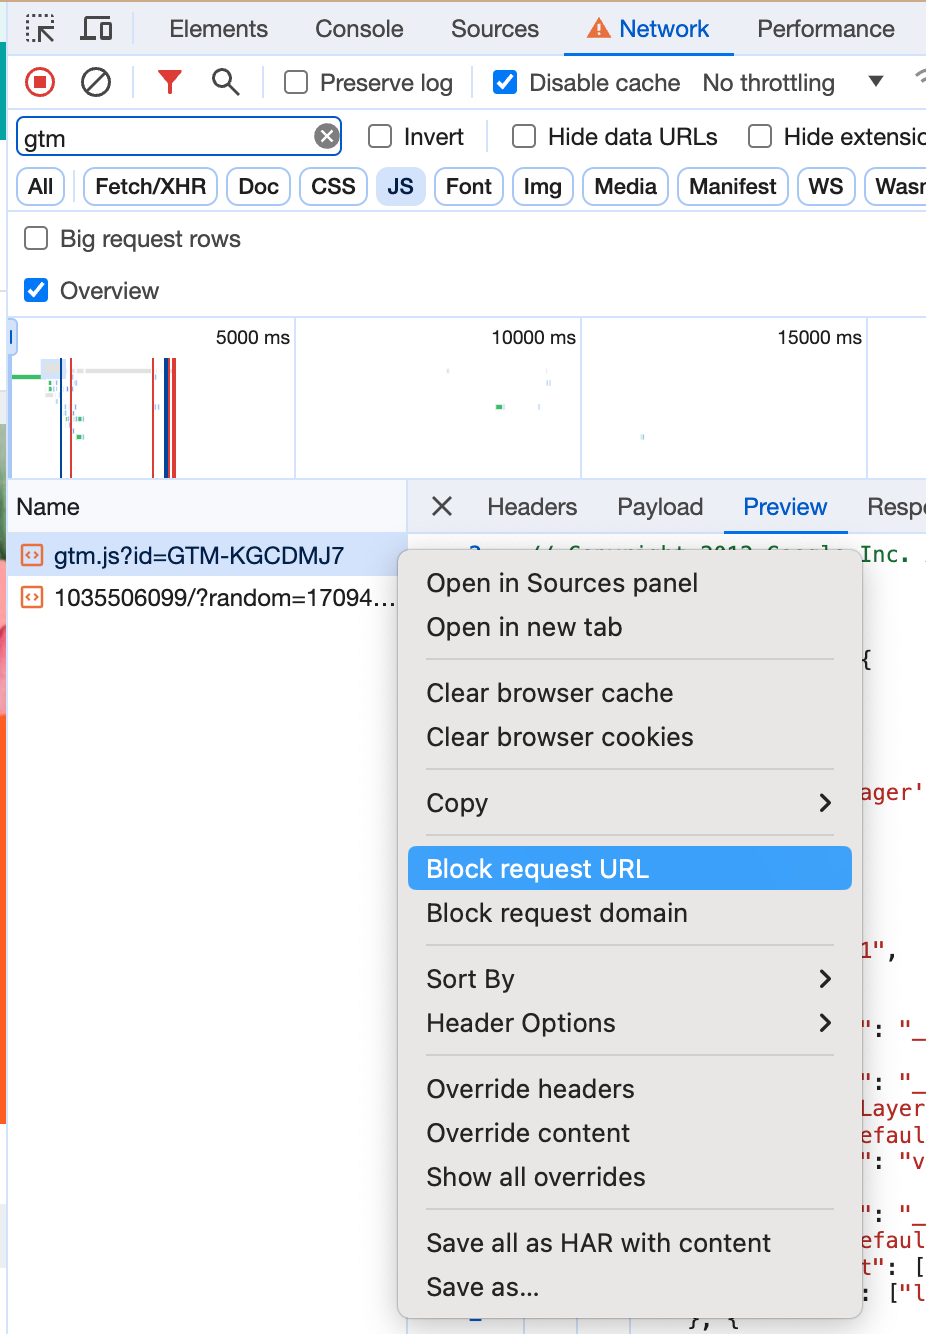
- Blocking scripts locally
- Remote debug on physical devices
Optimizing INP #
1. Splitting long tasks into smaller ones #
Some operations causing long tasks can be broken up into smaller ones. It helps the browser to perform other
critical operations like rerendering, handling event handlers etc. One of the methods to break up such
long tasks is using setTimeout. Using this, you can move part of the code to be done in another task.
More information: https://web.dev/articles/optimize-long-tasks#use_asyncawait_to_create_yield_points
2. Optimizing of event handling #
For long and complex operations handling the interaction, it is worth considering what is most critical
to display to the user. All non-critical operations can be postponed for execution after the browser has
rendered the next frame. This can be done using a combination of requestAnimationFrame and setTimeout functions.
This combination gives us the assurance that the given callback will execute no sooner than in the next frame.
element.addEventListener('click', () => {
  criticalOperations();

  requestAnimationFrame(() => {
    setTimeout(() => {
      nonCriticalOperations();
    }, 0);
  });
});
Short explanation about what is happening in the above code snippet: #
criticalOperations() is run synchronously when the event fires. Then, requestAnimationFrame (rAF) is called, which
schedules the given callback to the moment right before the next frame is rendered, meaning right before layout/paint/commit cycle.
If there is any other synchronous code, it is run now. Then comes the time to run the rAF, but the only operation is
setTimeout(..., 0), which adds it’s callback to the next event loop cycle, which is after the layout/paint/commit, which at
this point has already been scheduled.
The final order looks like this:
click event → criticalOperations() → requestAnimationFrame call → synchronous operations finished, browser schedules rendering →
rAF callback is run, schedules nonCriticalOperations using setTimeout → layout/paint/commit → frame is drawn on screen → nonCriticalOperations()
So, in combination, requestAnimationFrame + setTimeout ensures that nonCriticalOperations() run after the frame is rendered.
They need to be used in tandem to achieve that, none of them achieves it separately.
3. Be aware of “Layout thrashing” #
Some operations from JavaScript code can force layout style recalculation in order for the browser to calculate, for example, the new position of elements. Sometimes, suppose an operation like this appears in the wrong place in the code. In that case, it may be necessary for the browser to perform style recalculation in the middle of the task (synchronously), making it much longer. Especially if the recalculation affects many elements. Such situations occur most often when the styles of an element are changed and then immediately the values of those styles are requested in JavaScript. Avoid mixing read and update DOM operations in the same task.
// Example: BAD
function changeBoxSize(box) {
  box.classList.add('big');

  // Log box height
  console.log(box.offsetHeight);
}
// Example: BETTER
function changeBoxSize(box) {
    // Log box height
    console.log(box.offsetHeight);

    box.classList.add('big');
}
In the first (BAD) example the browser has to run a styles recalculation process synchronously to calculate the new height of the box element(“Forced reflow” in the browser).
In the second (BETTER) example there is no such problem. We can log the height value calculated during the latest rendering process.
After that there is a changing element styles operation. It’s fine in this example because it’s not going to force the browser to run styles
recalculation synchronously during the currently running task.
4. Using CSS content-visibility #
You can optimize rendering offscreen content by using the proper value of the content-visibility option. It can help the browser to specify
render priority (higher for content in the viewport and lower for out of viewport elements).
Read more: https://developer.mozilla.org/en-US/docs/Web/CSS/content-visibility
5. Minimizing DOM size #
In Lighthouse reports you can find recommendations for pages to contain fewer than ~1400 elements and the tree should not be deeper than 32 levels. Keeping the number of elements in the DOM as small as possible is important because large DOM can slow the page down in multiple ways, such as:
- Increased time of the first render due to network efficiency and load performance.
- Runtime performance — The browser must constantly recompute the position and styling of nodes. Large DOM can cause long styles recalculations that block the main thread for a long time.
Read more: https://web.dev/articles/dom-size-and-interactivity
6. Web Workers #
If some very long operations are hard to optimize, you can use Web Workers to run your JavaScript code in a dedicated thread. It allows you to not block the main thread during, for example, complicated calculations. However, there are some limitations to this solution. The code executed in the worker has its own global context (it does not have access to the window object). In addition, it is not possible to perform direct operations on the DOM.
You can find more information here: https://developer.mozilla.org/en-US/docs/Web/API/Web_Workers_API/Using_web_workers
INP in Allegro — a few examples #
1. Slow interactions — long tasks #
At Allegro, we have taken many actions and attempts to improve the INP score. By far, the most effective were attempts to diagnose long interactions based on RUM data and optimize them. This is crucial because one long interaction can spoil the INP results of the entire website (for visits with a small number of interactions, the time of the longest interaction is reported as the final INP result of the visit).
After locating and examining the troublesome interactions, it turns out to be crucial to divide long tasks into smaller ones and to defer non-critical operations until the next frame is rendered. This way, we let the browser decide how many of these tasks it can run before needing to perform another action, such as style recalculation, rendering the next frame, etc. Otherwise, if we put the entire complex interaction handling into a single long task, we do not give the browser any space to maneuver. In this scenario, the next frame can be rendered only after this long task is completed, as it will block the main thread for too long.
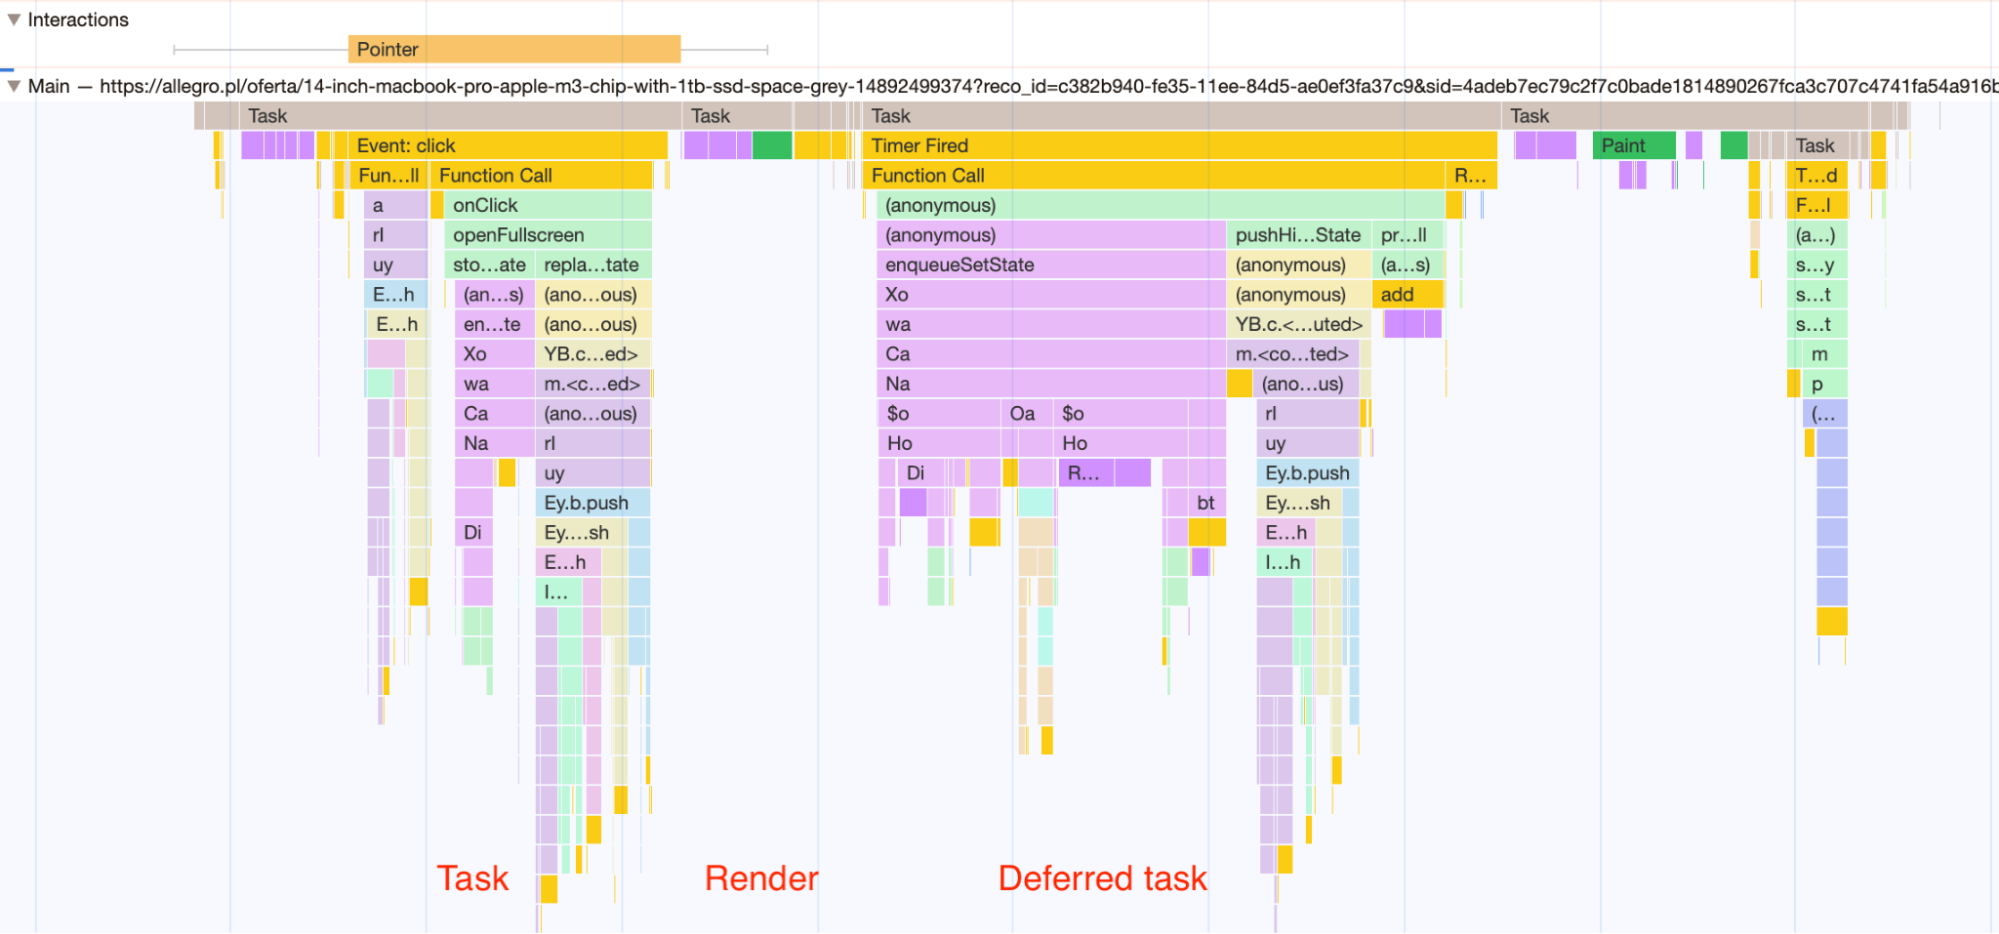
Below you can find an example of optimizing a long interaction on the offer page, which was opening and closing full-screen mode in a photo gallery,
at the top of an offer page. In this case, the long task was split into two smaller ones using the setTimeout function with a delay parameter value set to 0.
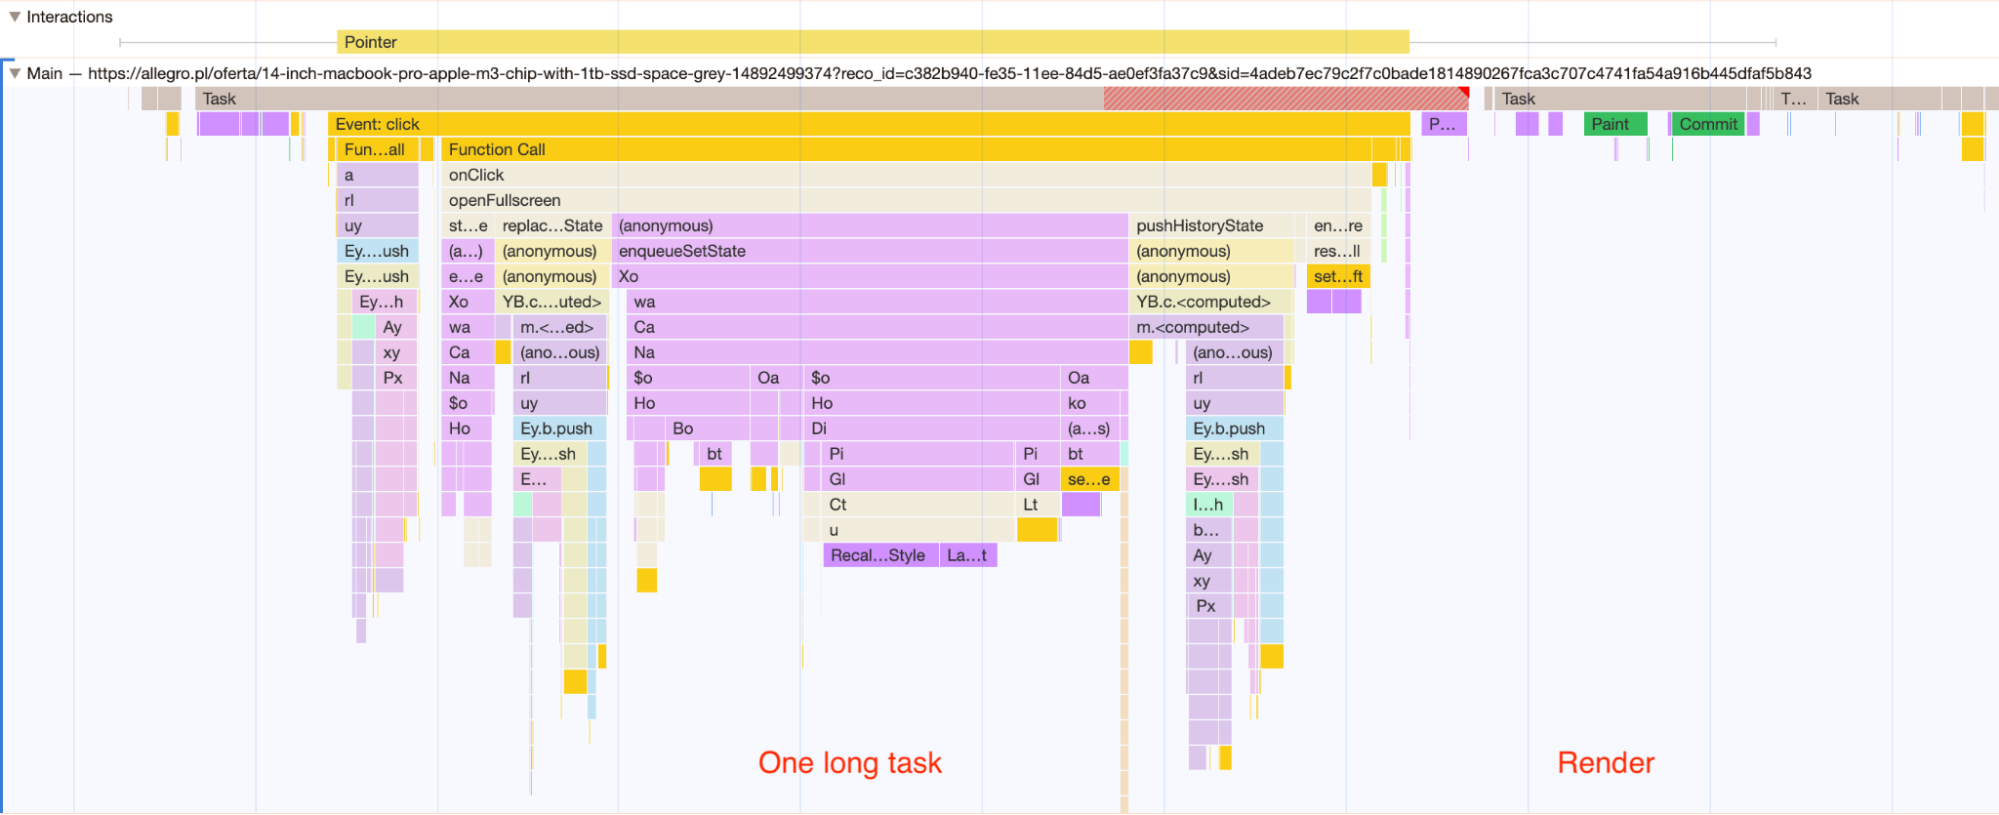 Example 1: All interaction handling is contained in one single task, which the browser reports as a “Long task”.
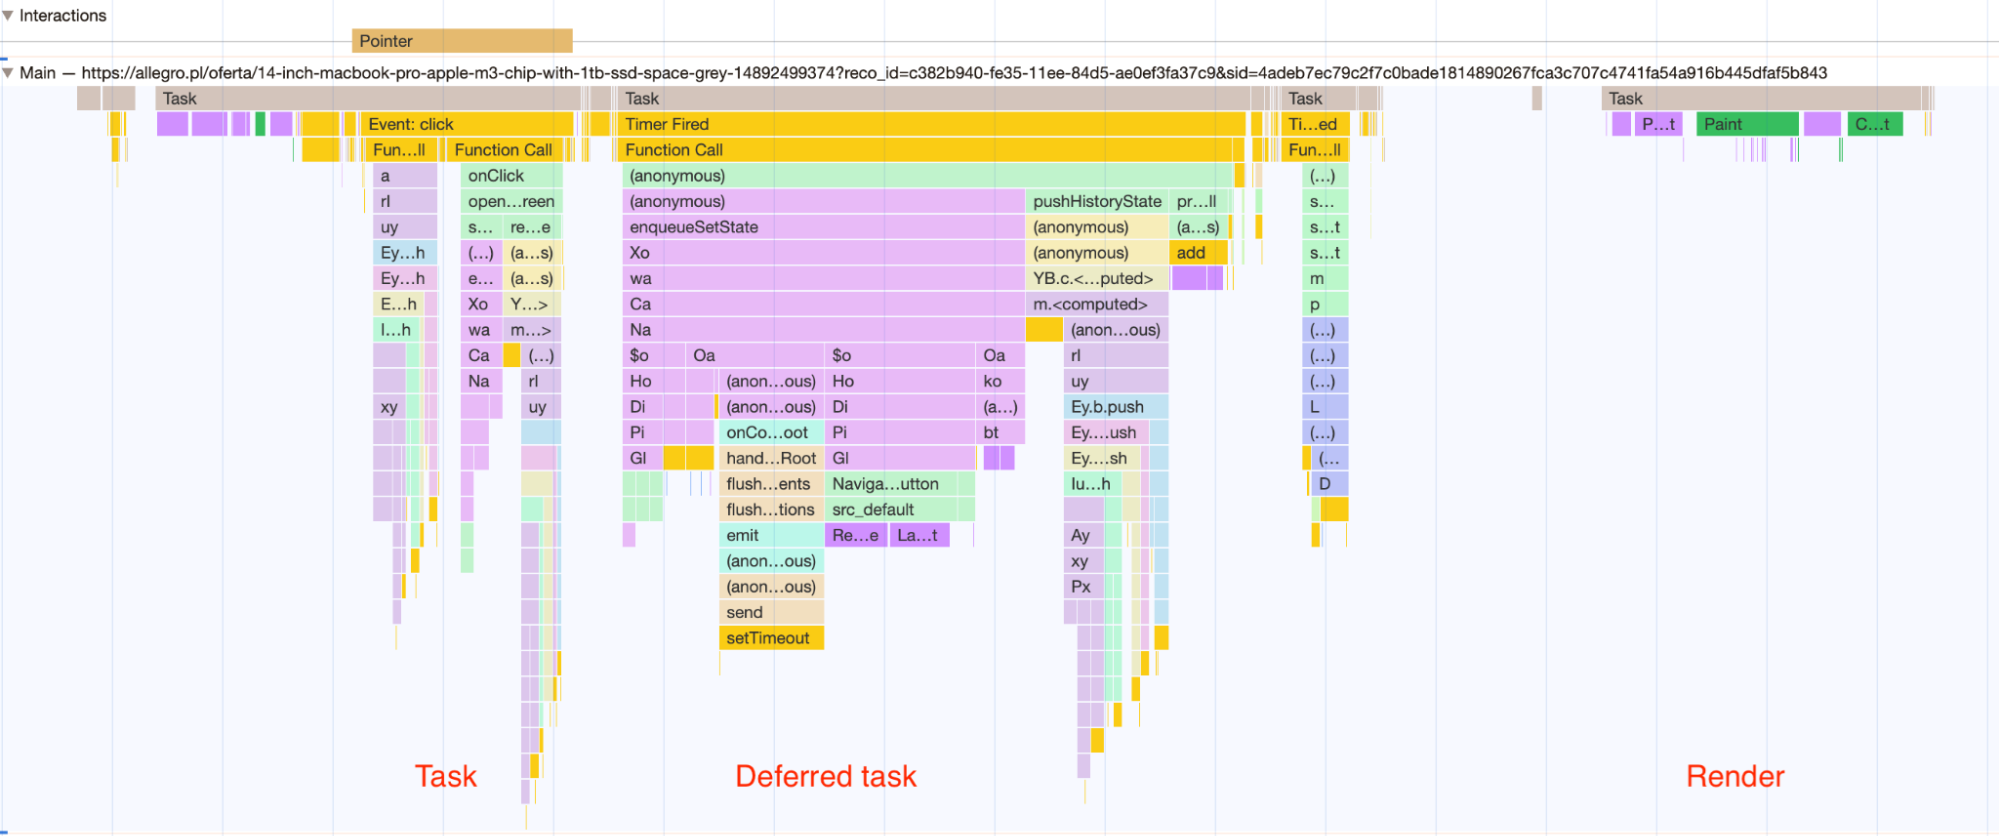
 Example 2: The same interaction handling after being split into two tasks. The entire non-critical part has been separated into the next task,
which can be started by the browser at a time suitable for it. In this case, you can see that a new frame was rendered between the two tasks,
and then the rest of the interaction handling was executed.
 Example 3: In this example, we can see exactly the same two tasks as in Example 2. The difference is that the first task finished quickly
enough, so the browser decided that it had enough time to perform the second task before the render.
2. Costly style recalculations #
Some style recalculations can be very costly. Among other things, it may be because one change in styles causes a change in many other elements.
Such a situation occurred in one of our interactions: opening a sidebar element (an element that slides out from the side, containing, for example,
information about delivery). The operation that caused costly style recalculation was the addition of a special CSS class to the body element,
which blocked the ability to scroll the content under the sidebar. This significantly increased the total processing time for opening the sidebar,
even though blocking the ability to scroll the content below was not critical and not the most important. The solution was to simply postpone
the operation of attaching CSS class to the body element until after the next frame had been rendered. This way, the user received the most
important visual effect of this interaction faster — opening the sidebar with important information.
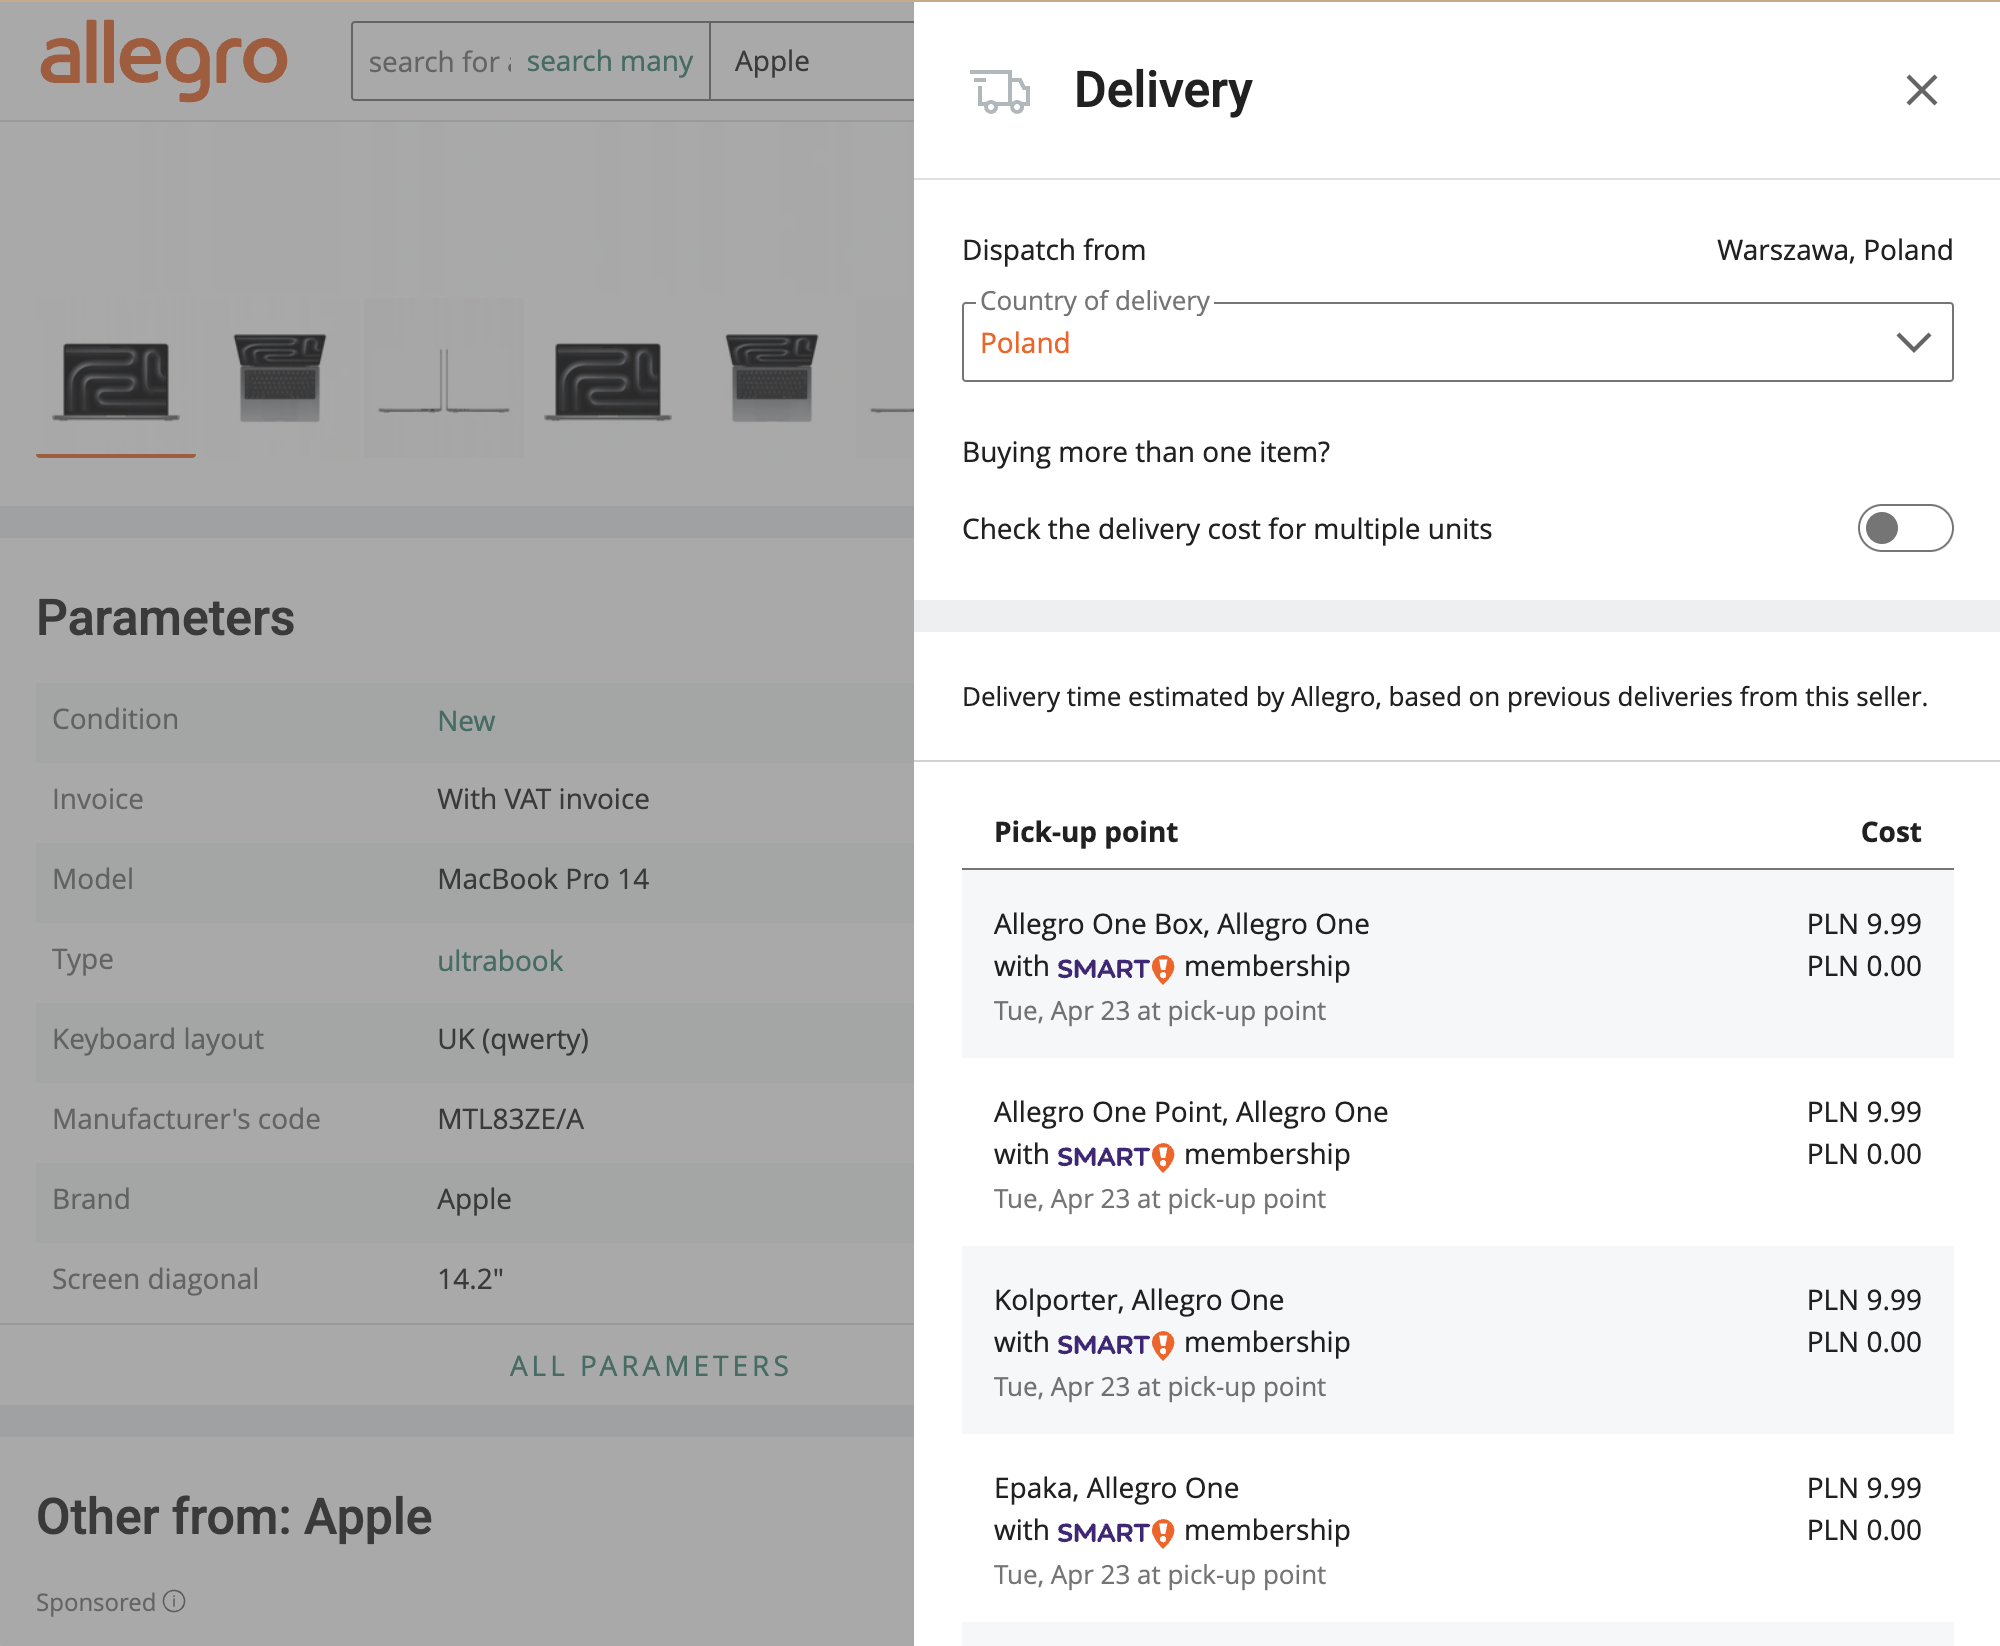 The sidebar component at Allegro
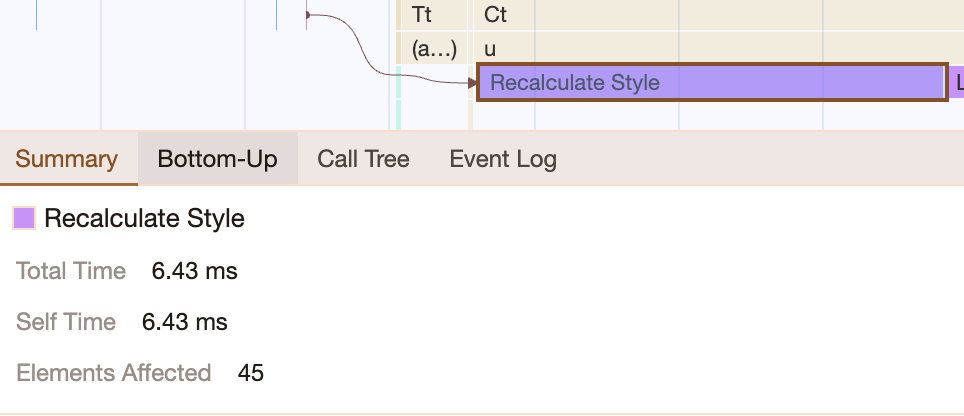 Information about how many elements were affected by style recalculation can be found in developer tools in the „Performance” tab.
3. Attaching global event listeners too early #
Global event listeners (e.g. on the global window / document object or body element) should be attached only if necessary.
Due to the event propagation in JavaScript, such listeners can be fired on any user interaction with the page. In many cases such
listeners are unnecessary or are enabled too early, e.g. as soon as the page loads.
An example of this behavior can be a modal element and the global event listener responsible for closing the modal when users interact with the overlay outside its boundaries. Such listeners should be registered just after opening the modal and removed just after the modal is closed. Then such a listener doesn’t interrupt the others and doesn’t extend them.
Does it change a lot? #
I think it does. Definitely, the introduction of INP has changed a lot in working with WebPerf. The new metric differs strongly from the FID it replaces. It forces a focus on all interactions, not just making the site interactive as quickly as possible. This requires digging in and understanding how interactions are processed by the browser. It also requires thinking about how other operations can affect the interactivity of the website.
We are still learning how to work in the new reality, so we would be excited if you share your own experiences with us!
Special thanks to Kamil Borzym, Paweł Lesiecki and Wiktor Czajkowski for their help with creating this post.
