Unveiling bottlenecks of couchbase sub-documents operations
This story shows our journey in addressing a platform stability issue related to autoscaling, which, paradoxically, added some additional overhead instead of reducing the load. A pivotal part of this narrative is how we used Couchbase — a distributed NoSQL database. If you find yourself intrigued by another enigmatic story involving Couchbase, don’t miss my blog post on tuning expired doc settings.
This post unfolds our quest to discover the root cause of the bottleneck. Initially, I will outline the symptoms of the issue. Subsequently, you will be introduced to how Couchbase is utilized by the aforementioned service. Equipped with this knowledge, I will recount our attempts to diagnose the problem and indicate which observations raised our suspicions. The following section is dedicated to conducting benchmarks to verify our predictions using a custom benchmarking tool. Ultimately, we will explore the source code of Couchbase to uncover how the problematic operations are executed. This section aims to provide a deep understanding of Couchbase’s inner workings. I firmly believe that the knowledge shared in that part is its most valuable asset and may enable you to swiftly identify and address some of the potential performance issues when using Couchbase.
Set the scene #
The service at the heart of the stability issues handles external HTTP traffic; for the purpose of this discussion, we’ll refer to it as “the gateway service”. The traffic routed to the gateway service reflects a pattern similar to organic traffic on Allegro, characterized by significant fluctuations in throughput between day and night hours. To efficiently utilize resources, the gateway service employs an autoscaler to dynamically adjust the number of instances based on current demands. It’s also important to note that spawning a new instance involves a warm-up phase, during which the instance retrieves some data from Couchbase to populate its in-memory cache. The gateway service relies on a Couchbase cluster comprised of three nodes.
Observations #
The team managing the service encountered a series of errors in communication with Couchbase. These errors indicated that 3-second timeouts occurred while fetching data from Couchbase:
com. couchbase.client.core.error.UnambiguousTimeoutException: SubdocGetRequest, Reason: TIMEOUT {
    "cancelled":true,
    "completed":true,
    ... IRRELEVANT METADATA ...
    "timeoutMs":3000,
    "timings":{"totalMicros":3004052}
}
Interestingly, during these incidents, the Couchbase cluster did not exhibit high CPU or RAM usage. Furthermore, the traffic to Couchbase, measured in operations per second, was not exceptionally high. I mean that other Couchbase clients (different microservices) were generating an order of magnitude more operations per second without encountering stability issues.
Additional key observations related to the issue include:
- The instability primarily occurred during the service scaling-up process, initially triggered by the autoscaler.
- Newly spawned instances were predominantly affected.
- The issues were reported solely for operations directed to a specific node within the cluster.
- A temporary mitigation of the problems involved repeatedly restarting the failing application instances.
- There was a noticeable pattern on the driver side that preceded the widespread errors, including timeouts and the inability to send requests due to a non-writable channel.
Temporary solution #
As a temporary measure, the team overseeing the gateway service implemented the following workarounds:
- Disabled certain types of requests to reduce the overall traffic volume directed to Couchbase.
- Deactivated the autoscaler, and manually scaled up the application to manage peak traffic loads.
These actions successfully halted the problems, but they also had repercussions, including business impacts and decreased efficiency in resource utilization.
Raising suspicions #
A pivotal aspect of this issue was the use of the Couchbase sub-document API within the gateway service, an approach not widely adopted across our internal microservice landscape, yet notable for its efficiency. According to the documentation, this API significantly reduces traffic by allowing the fetching or mutating only specific parts of a Couchbase document. Essentially, it acts as a substitute for the concept of projection, familiar to SQL users.
In our investigation we closely examined the data collected on the Couchbase node, the operational dynamics of the gateway service’s cache, and insights from scrutinizing both the Couchbase driver and server code. We hypothesized that the crux of the problem might be linked to the cache warm-up process for newly launched instances.
Our investigation uncovered several indicators pointing toward the core of the issue:
- A disproportionately large number of requests targeted a single document, inevitably directing traffic to a specific node.
- The node hosting this heavily queried document corresponded with the one mentioned in timeout-related logs.
- Instances that had been running for an extended period reported virtually no errors.
- The volume of requests to Couchbase from the affected instances was extraordinarily high, not aligning with the number of requests registered on the Couchbase side. This discrepancy suggested that if the cache warming process was at fault, the sheer magnitude of attempted requests was overwhelming even the local network buffers.
However, these observations were merely pieces of a larger puzzle. We noticed a “snowball effect” where the system’s inability to process an initial set of requests for newly initiated instances triggered a cascade of failures. But the question remained: Why? What made these instances different, and why didn’t other clients on the same cluster experience similar issues? This was the crucial moment to take a closer examination of the sub-document operations to determine their efficiency and optimization.
Let’s benchmark it #
Despite an extensive search, we were unable to locate any tools capable of reliably testing our hypothesis—that sub-document operations executed during the warm-up phase could significantly challenge Couchbase’s handling capabilities. As a result, we developed a simple tool and made it available in on GitHub. This tool is designed to create a sample document and then execute parallel sub-document fetch operations concurrently. The sample document is structured as follows:
{
    "key": "test-subdoc",
    "data": {
        "subkey-000000": "value-000000",
        "subkey-000001": "value-000001",
        . . .
        "subkey-0….N": "value-0…..N",
    }
}
The tool allows manipulating several knobs, which includes:
- Parallelism: Determines the number of parallel goroutines that will attempt to fetch the same sub-documents concurrently.
- Document Size: Defined by the number of sub-keys, this directly affects the document’s binary size.
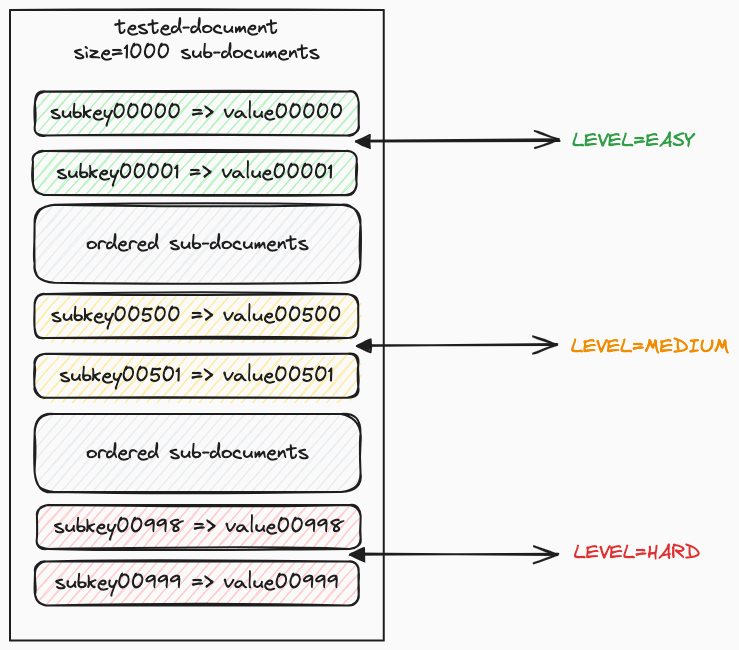
- Level of Search Difficulty: This essentially refers to how deep or how far into the main document the target sub-document is located. The concept is illustrated in the diagram below:
Caveats #
The primary objective of this exercise was to identify potential bottlenecks, not to conduct a highly accurate performance assessment of Couchbase clusters.
Therefore, we opted to run our experiments using a local Docker container (couchbase:community-6.6.0), rather than on a dedicated, well-isolated cluster.
We acknowledge that hosting both the server and the benchmarking tool on the same machine may compromise the reliability and accuracy of the results.
Consequently, we advise against using the findings from these tests for comprehensive assessments or comparisons with other technologies.
Benchmark steps #
The procedure for each experiment follows a similar framework, outlined in the steps below:
- Document Preparation: Initiate the document with the desired number of sub-documents, as dictated by one of the experimental variables.
- Document Storage: Save this document under a predetermined key.
- Goroutine Initialization: Launch a specified number of goroutines, the quantity of which is determined by another experimental variable.
- Fetch Operations: Each goroutine executes a series of fetch operations, which can be either regular (retrieving the entire sample document) or sub-document (accessing a set of sub-documents). It’s important to note that these requests are executed in a blocking manner; a new fetch operation is performed only after the completion of the preceding one. In sub-document mode, the difficulty of the fetch operation is controlled through an experiment variable.
- Completion Wait: Await the termination of all goroutines.
- Results Reporting: Calculate and display the estimated RPS (requests per second).
Estimate baseline #
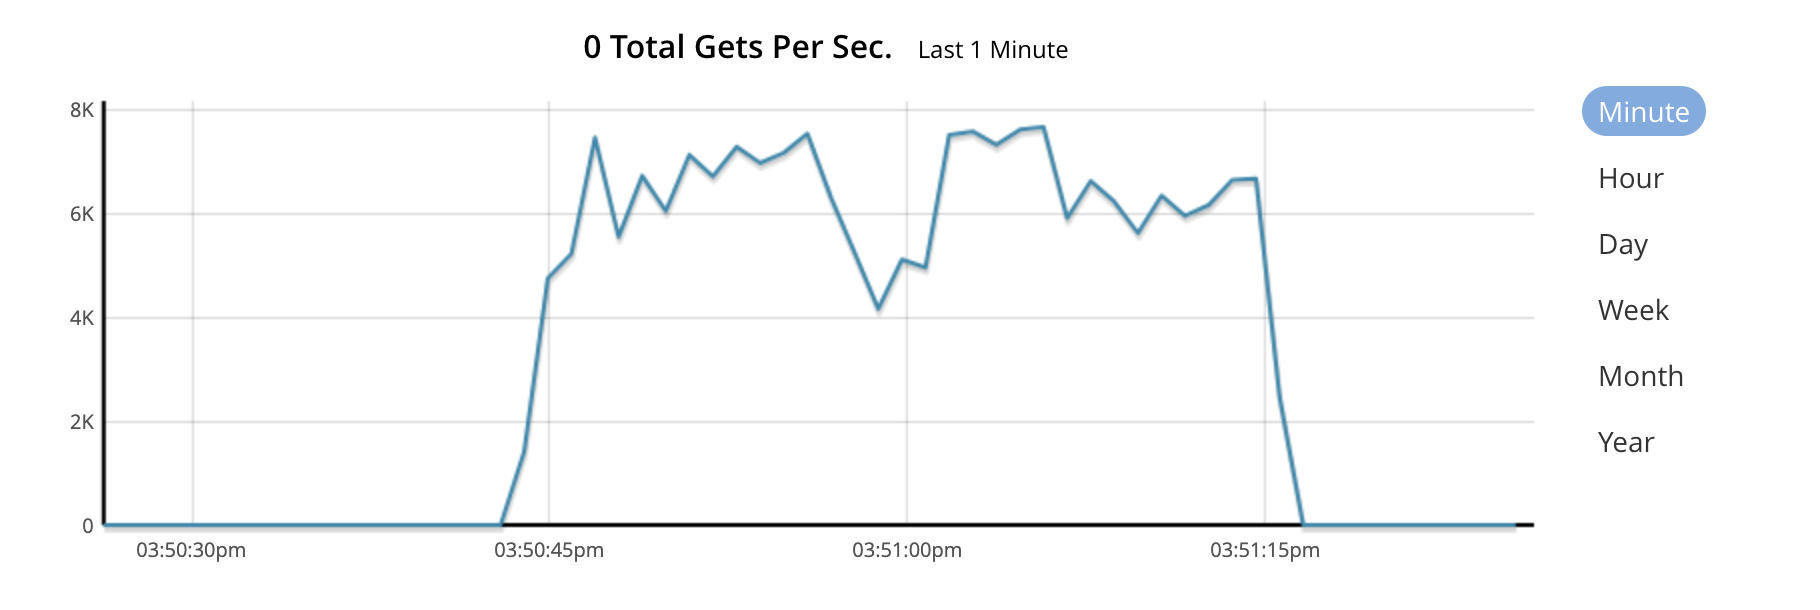
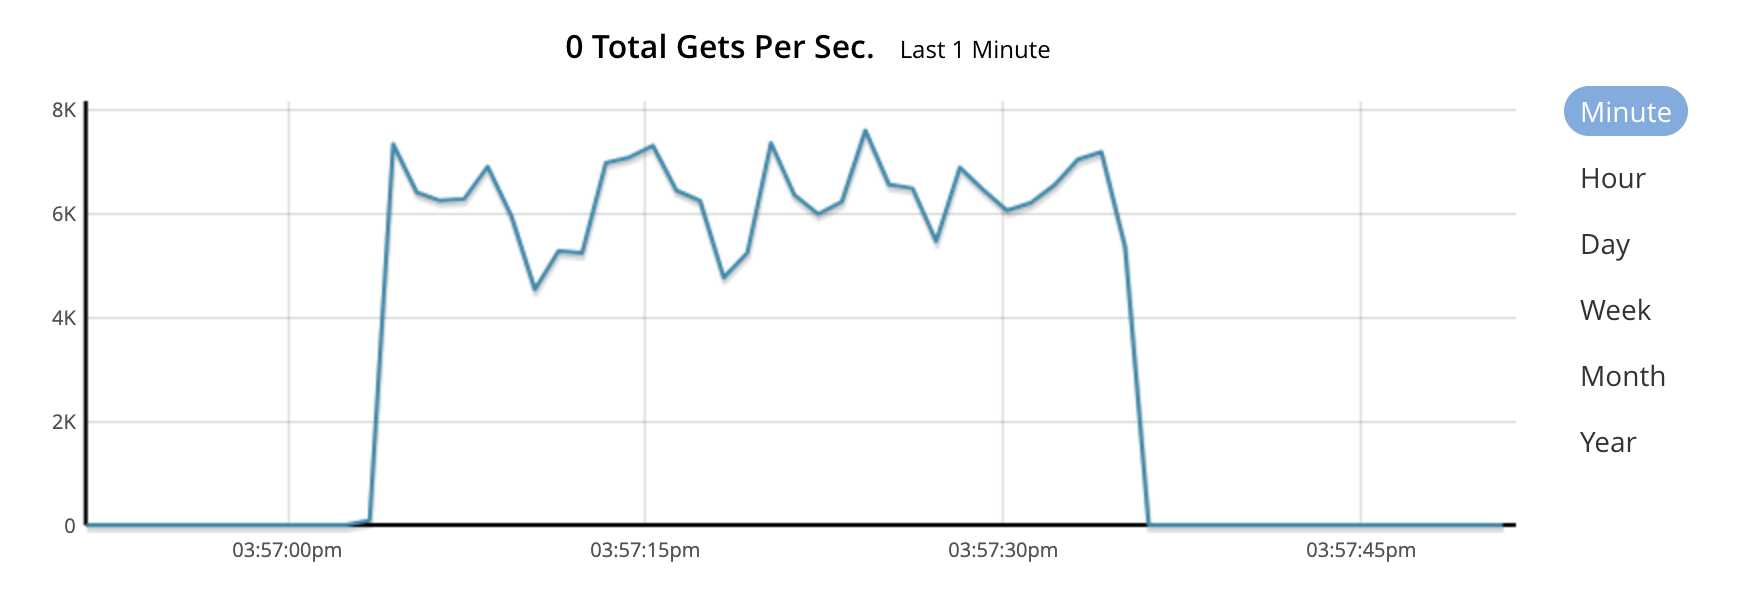
Prior to delving into sub-document operations, we sought to establish the maximum number of regular get operations that our local Couchbase Server instance could handle. Through testing at various levels of concurrency, we determined the maximum throughput for our specific setup. It was approximately 6,000 to 7,000 RPS, regardless of whether the requests were for small documents (less than 200 bytes) or for non-existent documents. These findings were further validated by the statistics available through the Couchbase UI.
Benchmark Command: Attempting to fetch a non-existent document yielded a rate of 6388 RPS.
./cb-perf-tester regular  --parallel 200 --repeat 1000 --keys 5 --search-non-existent
Using config file: /Users/tomasz.ziolkowski/.cb-perf-tester.yaml
benchmark params: keys=5, not-existent=true, repeats=1000, parallel=200
Generated doc with subkeys: 5, byte size is: 195

search for key: not-exists

regular report: successes: 0, errors: 200000, duration: 31.306684977s, rps: 6388.411937, success rps: 0.000000
Benchmark Command: Fetching an existing small (195 bytes) document yielded a rate of 6341 rps.
./cb-perf-tester regular  --parallel 200 --repeat 1000 --keys 5
Using config file: /Users/tomasz.ziolkowski/.cb-perf-tester.yaml
benchmark params: keys=5, not-existent=false, repeats=1000, parallel=200
Generated doc with subkeys: 5, byte size is: 195

search for key: test-regular

regular report: successes: 200000, errors: 0, duration: 31.536538682s, rps: 6341.850068, success rps: 6341.850068
Testing scenarios #
Now that we have a baseline for comparison, we’re set to evaluate it against the outcomes of various scenarios. To ensure the tests are comparable, we’ll maintain constant parallelism across all tests, specifically using 200 goroutines. The variables that will differ across scenarios include:
- Total Number of Sub-Documents: This determines the overall size of the sample document, as the document’s size is directly related to the number of sub-documents it contains.
- Number of Searched Sub-Documents: This refers to how many sub-paths within the sample document will be targeted in a single fetch operation.
- Search Difficulty: This aspect dictates the difficulty of locating the searched sub-paths within the document.
It’s important to highlight that in each scenario, we will manipulate only one variable at a time while keeping the other parameters constant.
Scenario A: The impact of document size on performance #
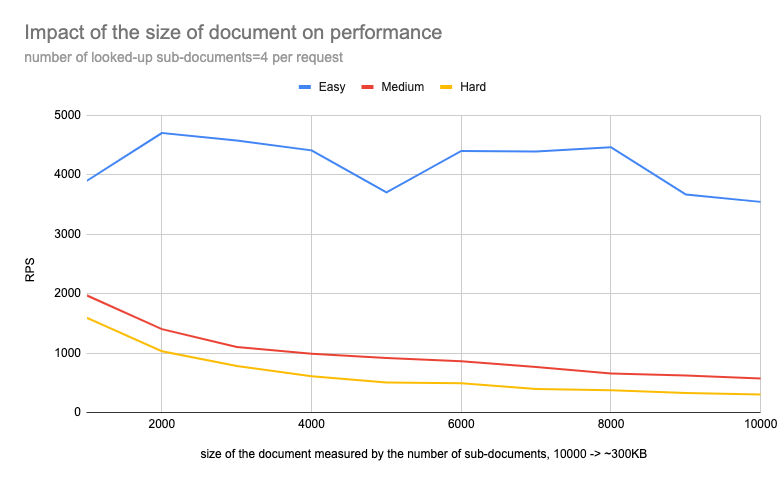
To better visualize the impact, let’s look at the diagram for HARD scenario:
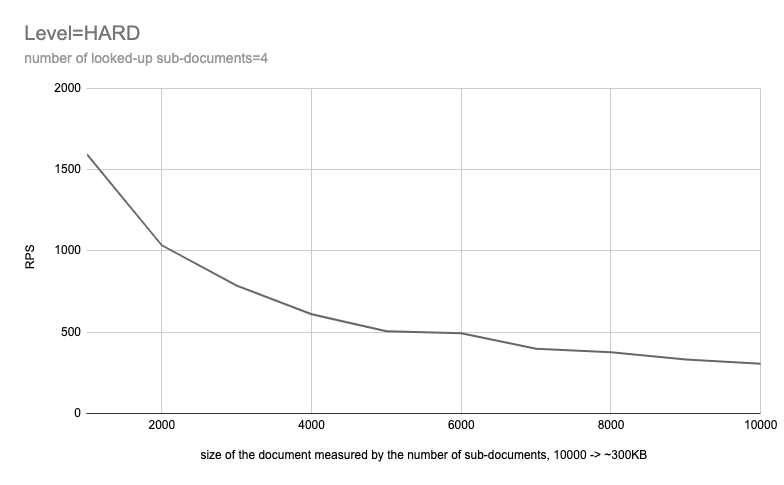
It is clearly visible that there is a strict correlation between document size and performance.
Scenario B: The impact of the number of searched sub-documents on performance #
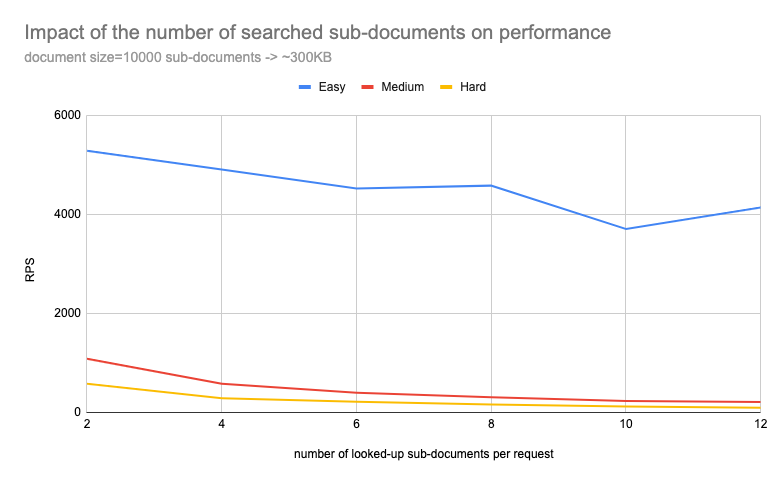
To better visualize the impact, let’s look at the diagram for HARD scenario:
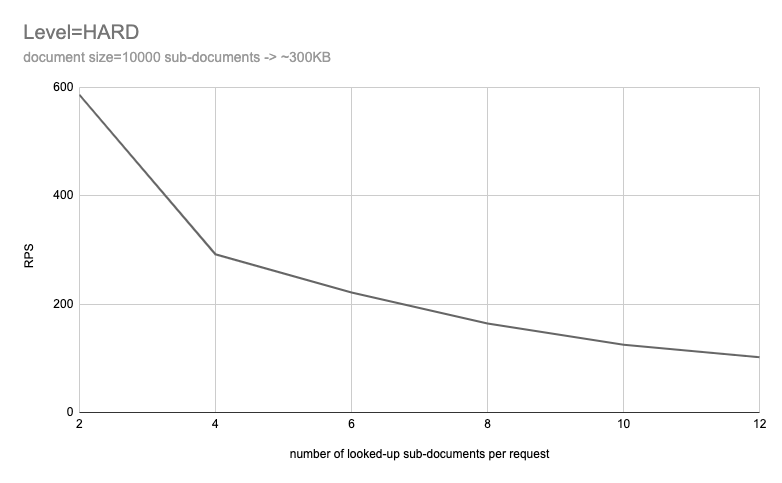
As observed in the previous scenario, there is a clear correlation between the number of sub-documents accessed and the system’s performance.
Further analysis #
Given the evident correlation between the document size/number of queried sub-paths and performance degradation, we delve into the mechanics to understand
the root cause of these test results. A notable observation during the tests relates to CPU utilization within the Docker environment, where, despite having
six cores available, only a single core was actively utilized. Intriguingly, this usage was monopolized by a single thread (mc:worker_X).
This phenomenon directly stems from Couchbase’s handling of Key-Value (KV) connections. By default, the Couchbase driver initiates only a single connection to
each cluster node for KV operations. However, this configuration can be adjusted in certain Software Development Kits (SDKs)—the Java SDK,
for instance, allows modification through IoConfig.numKvConnections.
When a connection is established, Couchbase assigns it to a specific worker thread) using a Round-Robin (RR)) algorithm. As a result, the Couchbase Server does not fully utilize available CPU power for a single connection, even when a lot of resources are free. This behavior can be seen as beneficial, serving to mitigate the “noisy neighbor” effect, provided there are sufficient spare cores available to manage new connections. This mechanism ensures balanced resource use across connections, as illustrated in the diagram below:
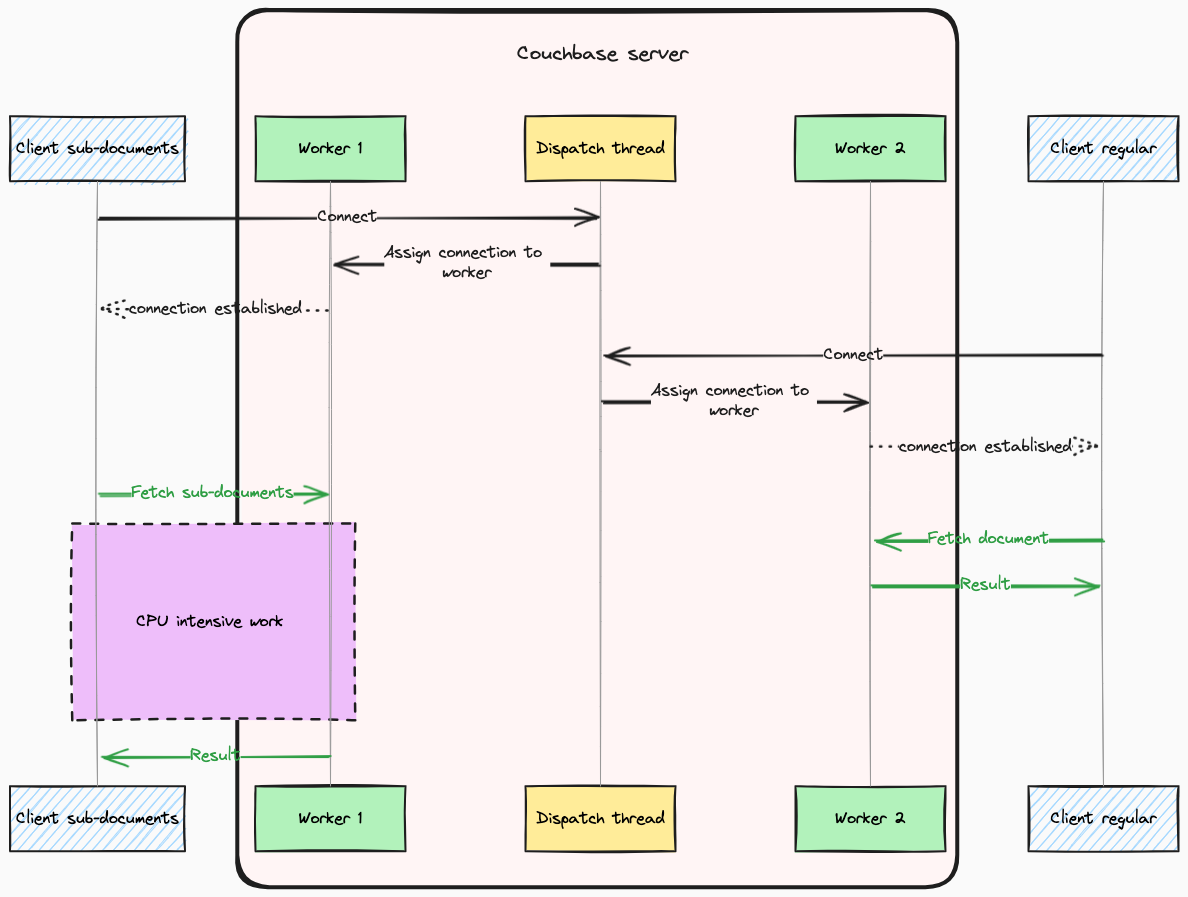
Conversely, one may encounter fluctuating performance due to instances of misfortune, where if other clients significantly burden certain worker threads, and your connection is allocated to one of these overloaded threads, performance inconsistencies arise. This scenario, where a client experiences higher than usual response times due to an imbalanced distribution of workload across worker threads, is depicted in the diagram below:
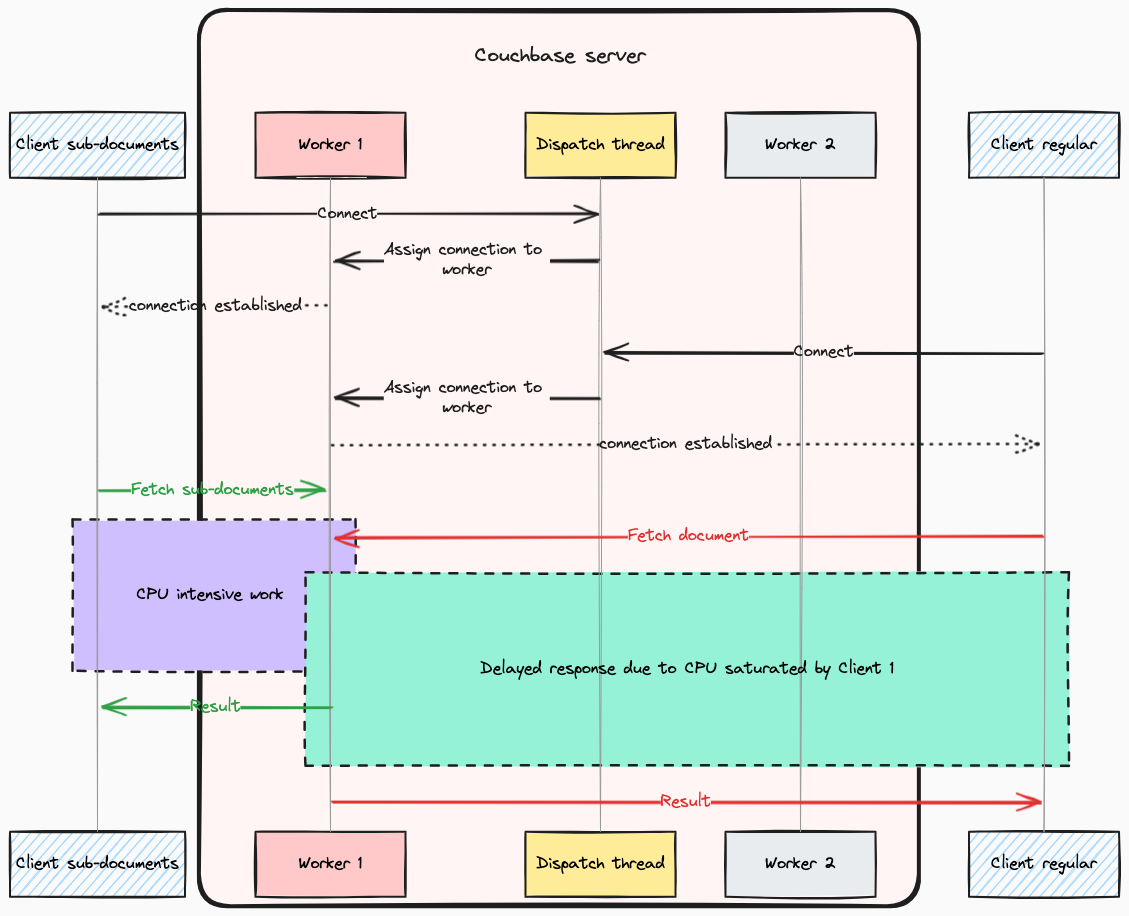
This behavior explains the apparent paradox observed during the stability issues: the Couchbase node showed no clear signs of being overloaded, yet certain anomalous symptoms were present, such as a metric indicating the minimum idle percentage across all cores plummeting to 0% during the disturbances. This leaves no doubt that operations on sub-documents have the potential to overburden worker threads within the Couchbase Server. With this understanding we are now ready to delve deeper into the root cause of such behavior.
What documentation says #
The documentation for Couchbase, housed alongside the server’s source code, is notably comprehensive, including a dedicated section on sub-documents. However, it falls short of providing detailed insights into the internal workings of these operations. Additionally, there is a lack of discussion on the performance implications of sub-document operations, with only a few remarks on data typing and float numbers that do not apply to the cases we tested. Attempts to find answers on the Couchbase forum were also unfruitful, yielding no substantial information on the performance issues we encountered. Despite this, there is confirmation from others in the community who have observed similar problems.
What source code says #
A thorough analysis of the codebase reveals a definitive cause for the performance degradation observed. It’s important to note that Couchbase requires decompression of a document for any lookup or manipulation operation, whether the document is retrieved from RAM or disk. Let’s start from a point where Couchbase starts doing lookups on a decompressed object:
// 2. Perform each of the operations on document.
for (auto& op : operations) {
    switch (op.traits.scope) {
    case CommandScope::SubJSON:
        if (cb::mcbp::datatype::is_json(doc_datatype)) {
            // Got JSON, perform the operation.
            op.status = subdoc_operate_one_path(context, op, current.view);
        }
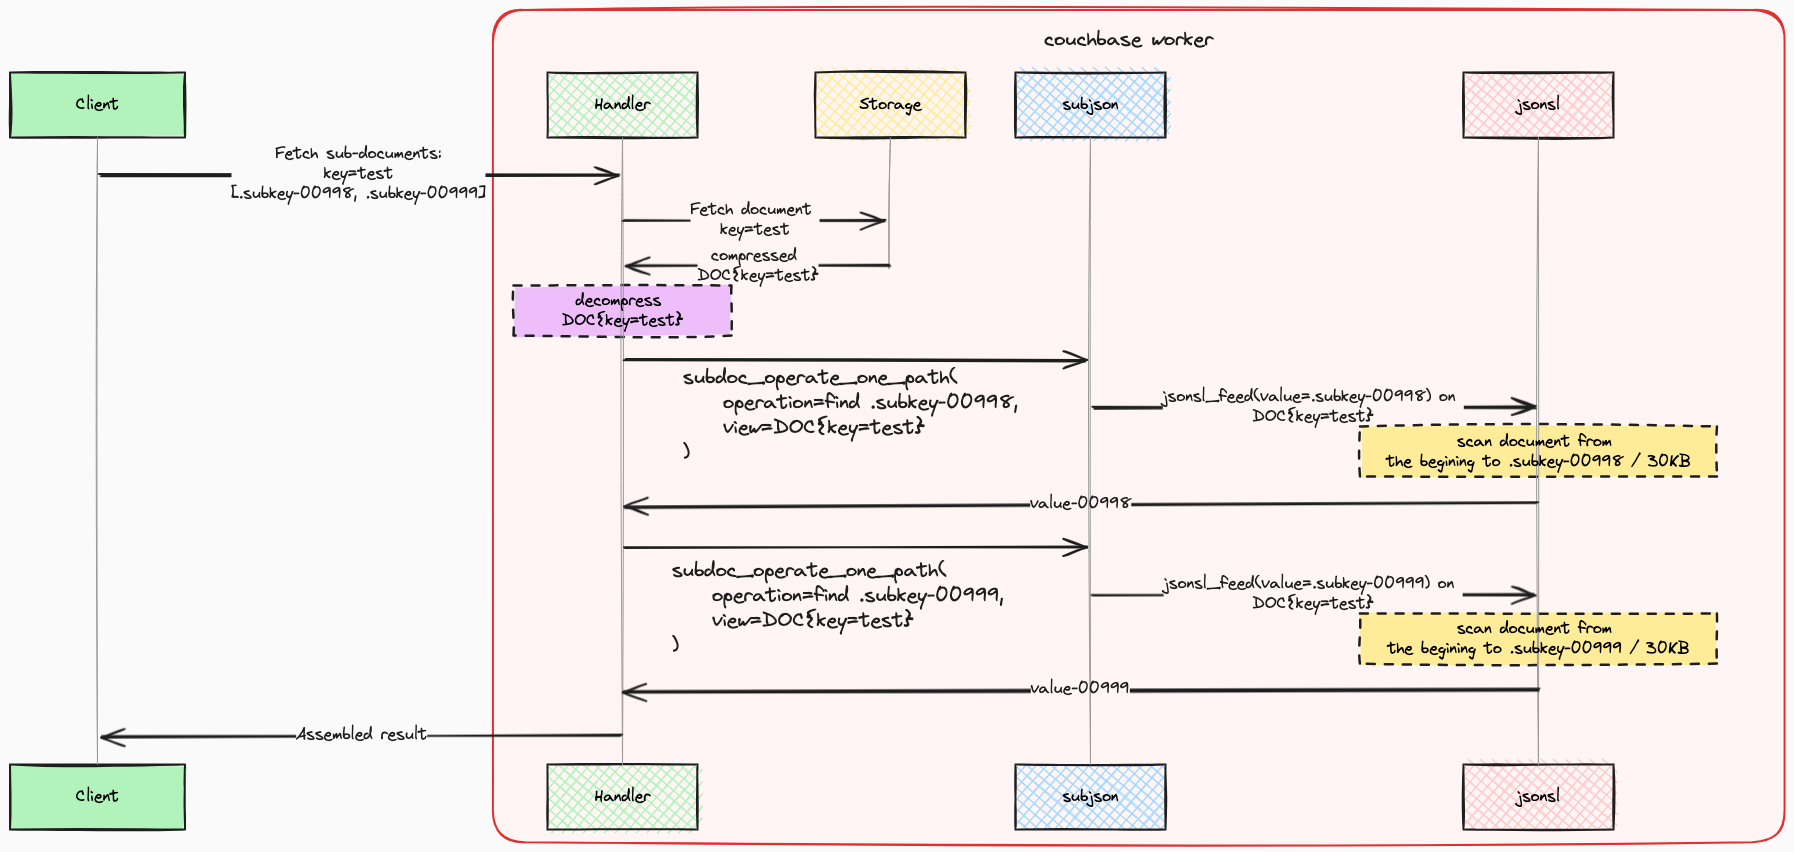
A critical observation from our analysis is that each operation (lookup) is executed sequentially through the invocation of subdoc_operate_one_path.
To understand the performance implications, let’s examine
the implementation of this lookup
process:
// ... and execute it.
const auto subdoc_res = op.op_exec(spec.path.data(), spec.path.size());
The Investigation reveals that the lookup functionality is powered by a specialized library,
library subjson, which in turn
uses
the jsonsl library for parsing JSON in a streaming manner. An enlightening piece of information about performance can be found in
the README of the subjson library, which is integral to Couchbase’s solution. The direct quote from the README is as follows:
Because the library does not actually build a JSON tree, the memory usage and CPU consumption is constant, regardless of the size of the actual JSON object being operated upon, and thus the only variable performance factor is the amount of actual time the library can seek to the location in the document to be modified.
On a single Xeon E5520 core, this library can process about 150MB/s-300MB/s of JSON. This processing includes the search logic as well as any replacement logic.
This analysis clearly demonstrates that lookups targeting paths situated towards the end of a document are markedly slower compared to those aimed at the beginning. Moreover, each sequential lookup needs to repeat document parsing. The impact of this implementation on performance is significant. For a more intuitive understanding of these effects, please refer to the diagram below:
The performance characteristics we’ve outlined align with the outcomes observed in our experiments. To illustrate, consider a detailed examination of
a single HARD test scenario—specifically, a case where the sub-documents targeted for search were positioned towards the end of the JSON document:
./cb-perf-tester subdoc  --parallel 200 --repeat 50 --search-keys 10 --difficulty hard
Using config file: /Users/tomasz.ziolkowski/.cb-perf-tester.yaml
benchmark params: keys=10000, level=Hard, search-keys=10, repeats=50, parallel=200
Generated doc with subkeys: 10000, byte size is: 310043

search for subkeys [level=Hard]: [data.subkey-009999 data.subkey-009998 data.subkey-009997 data.subkey-009996 data.subkey-009995 data.subkey-009994 data.subkey-009993 data.subkey-009992 data.subkey-009991 data.subkey-009990]

subdoc report: successes: 10000, errors: 0, duration: 1m19.784865193s, rps: 125.337055, success rps: 125.337055
By multiplying the size of the document by the number of sub-documents queried, we can determine the total stream size that the library must process, which,
in this case, approximates to ~3MB. Further multiplying this figure by the RPS gives us an insight into the overall throughput of
the stream processing:
3MB x 125 RPS ~= 375 MBps
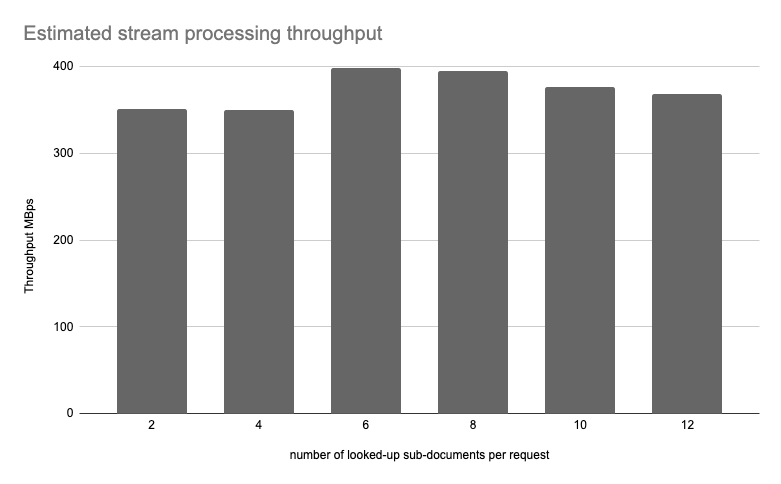
The calculated throughput slightly exceeds the benchmarks outlined in the README. Moreover, the estimated throughput remains nearly constant across
various tests. For a comprehensive view of these findings, please refer to the diagram below, which displays the estimated throughput for tests conducted under
the HARD level with a document size of approximately 300KB:
Conclusions #
The Couchbase sub-document API, while designed to optimize network throughput, introduces significant performance trade-offs. Notably, even under optimal conditions, operations on sub-documents are noticeably slower compared to regular get operations fetching small documents—evidenced by a comparison of the baseline performance; approximately 4-5k RPS for sub-document operations vs. 6-7k RPS for regular get operations.
The method Couchbase employs for executing lookups directly influences performance, manifesting declines as either the document size increases or the number of lookups per request raises. This slowdown affects all requests over the same connection due to the high CPU demand of sub-document lookup operations. Particularly in environments utilizing reactive/asynchronous clients, this can overload the Couchbase worker thread, leading to a halt in request servicing. Importantly, an overloaded worker may manage connections from multiple clients, potentially exacerbating the “noisy neighbor” effect.
While there are strategies to mitigate these issues from the perspective of a client, such as the gateway service, these considerations warrant a separate discussion, which I plan to address in a future blog post.
