Clever, surprised and gray-haired
This article is a form of a public postmortem in which we would like to share our bumpy way of revealing the cause of a mysterious performance problem. Besides unveiling part of our technical stack based on open-source solutions, we also show how some false assumptions made such a bug triage process much harder. Besides all NOT TO DOs, you can find some exciting information about performance hunting and reproducing performance issues on a small scale. As a perk, we prepared a repository where you can reproduce the problem and make yourself familiar with tools that allowed us to confirm the cause. The last part (lessons learned) is the most valuable if you prefer to learn from the mistakes of others.
Before you start reading, I must warn you that it will be a pretty long story, and following it without technical knowledge will be challenging. However, I tried my best to simplify the technicalities as much as possible. If, despite all discouragement, you are interested in solving technical mysteries, take a sip of coffee and enjoy the story!
Clever: what have we built? #
A few years ago, we researched several platforms that can be used as transparent HTTP proxies capable of handling HTTP traffic to our services. We needed a solution that would be able to inspect metadata and user data against any suspicious patterns and decide if such traffic should be processed or banned. We chose nginx in concert with ModSecurity as a foundation for a more complex ecosystem.
During increasing usage of such a stack, more than simple non-contextual rules was needed for more complex traffic analysis. One of the most crucial needs was providing the ability to store some contextual information connected with session activity in order to better recognize malicious patterns. By default, ModSecurity allows storing contextual information in memory. Such an approach is not very useful in connection with HTTP servers that utilize multiprocessing as nginx does.
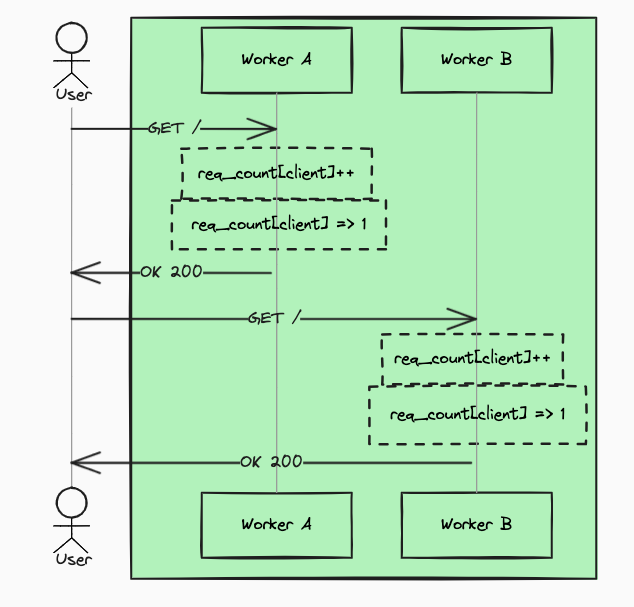
However, we learned that ModSecurity can use LMDB as an internal fast storage for contextual information that could be shared between requests that come, for example, from the same IP address. LMDB approach ensures that contextual information stored by one nginx worker process is accessible by others.
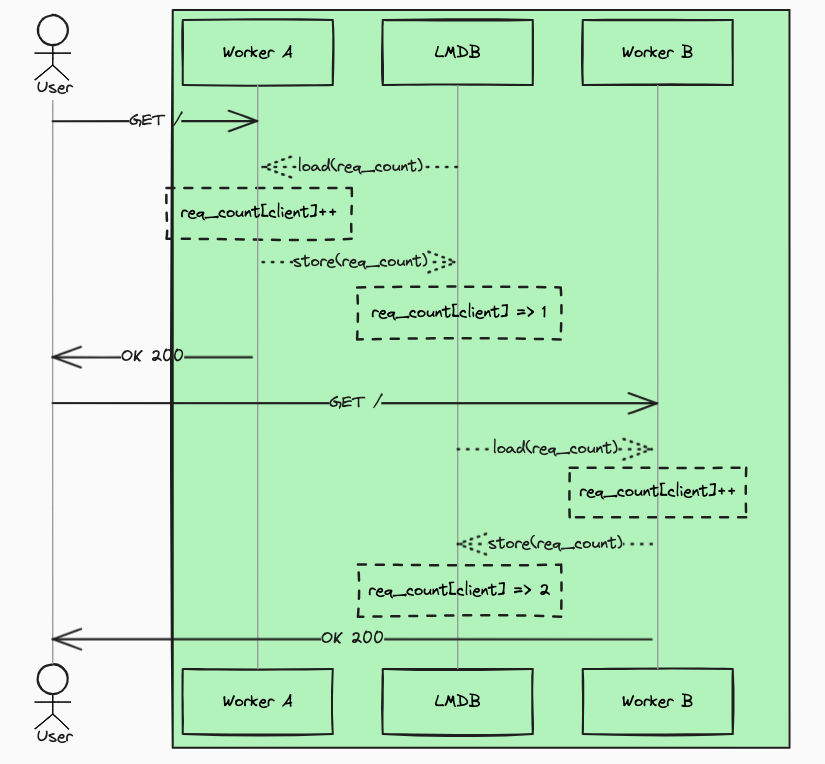
At first glance, it looks great; however, in our case, we could not rely on information that is stored directly by ModSecurity. As you can imagine, our setup is based on more than one server, so we have to be able to pass the same contextual information to each of them. Moreover, our algorithms that compute such information are complex and reach for more data than those available to ModSecurity.
Nevertheless, LMDB has one great advantage: it allows connecting to it from outside the nginx process and altering the contextual data that is available to ModSecurity. We built a mechanism that syncs contextual information from dedicated service to LMDB on each transparent proxy host. A simplified view of the architecture that allows computing and synchronizing contextual information is depicted below (dotted lines represent asynchronous flow):
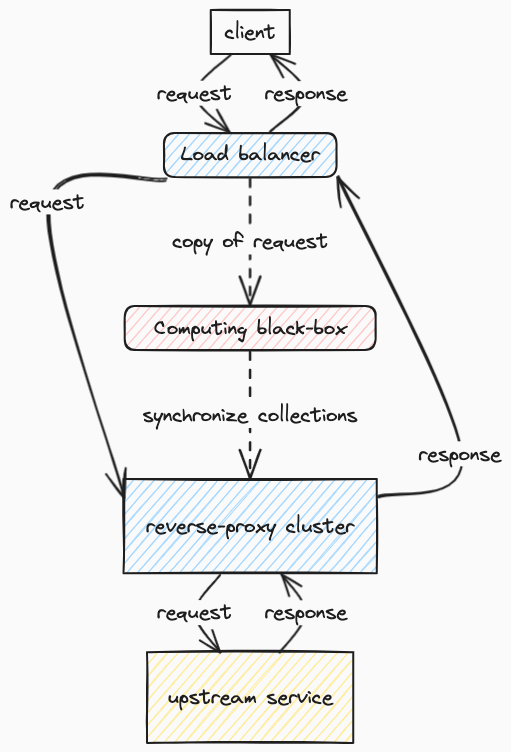
Such a PoC gave us promising results regarding how fast the contextual information could be provided and how fast it was retrieved by ModSecurity. Finally, we rolled out the new approach, and everything worked smoothly for such a long time that we assumed it was a rock-solid solution.
Surprised: once upon a time, the problem occurred for the first time #
We noticed that response time from the client’s perspective soared, and the number of established connections also increased. Such a correlation is not strange and was noticed many times in the past when the upstream that handles requests from proxy started responding slower. What was mysterious in that case was that there was no evidence of a problem on the upstream side besides the metric from nginx that was based on $upstream_connect_time. According to that metric, connecting to the upstream had slowed down significantly.
Having such a clue we blamed the part of infrastructure that is always to blame if no one knows what is happening. As you probably guessed, we assumed that was a temporary network issue (from my experience, it is the best justification to not dig more profound). Unfortunately, the network issue started occurring quite often, at least a few times a week. Strangely enough, if we disable the transparent proxy, the network seems to be stable. Once again, we were convinced that someone from the network team devised blameless culture. Hence, we started to verify a lot of new hypotheses, from those scary (cyber war, specialized attacks that are hidden in regular traffic) to those that bring smiles upon our faces at least for today (backdoor left by Russian spy in the nginx source code). Falsification of those hypotheses that were at least partially backed up by data is a great story about how to teach engineers that correlation does not mean causation.
Turn gray: investigation #
Let me introduce a simplified view of our infrastructure to show where we gathered data.
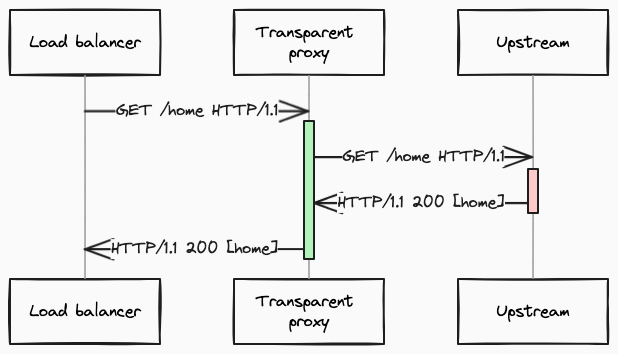
All proxies measure at least the total processing time, including the time consumed in the proxy and the time that was consumed outside the proxy (passing the request to the next server in the above chain and waiting for the response). And those parts could be analyzed independently. Based on such measurements, we can simply compute the approximate overhead of the proxy as a difference between the whole request (green box) processing and the upstream (red box) waiting. Having that, we were able to discover that the time consumed in transparent proxy was not increased significantly; only the time consumed outside of proxy was raised (red box). It was one of the big lies that hindered revealing the truth. You can find a broader explanation of misleading metrics in the lessons learned part. After excluding network issues, and upstream issues, we were pretty sure that the problem lay in transparent proxy, and we started to doubt what we saw in metrics. It took a while, but finally, we were able to break our unwavering trust in data. Relying on data is encoded in our company DNA, so trusting it was a natural instinct, unfortunately, a bad one in this case.
Having that, we could not rely on metrics provided by a transparent proxy. We were starting to try out other means to measure what was going on inside the transparent proxy. Being biased by network issues, we started gathering a lot of network-related information that only showed correlations with problems, but it did not give any clues about what was happening.
It was a time to use the more straightforward but quite heavy solution - access logs. However, logs are not very useful in giving the overall condition of the proxy; they can be beneficial in analyzing singular problems. When the problems occurred again, we had some data that we could scrutinize. It turned out that an excellent idea was to log exact timestamps in a very high resolution (which was not default). Below, you can see a real example reproduced in the local environment (which will be described later). Each line contains nginx worker process id, timestamp, request_time, upstream_request_time, upstream_connect_time and the response status code.
pid:41 t:1700163031.929 rt:8.990 urt:8.990 uct:7.128 status:200
pid:41 t:1700163031.929 rt:12.348 urt:12.348 uct:3.358 status:200
pid:41 t:1700163031.929 rt:8.990 urt:8.990 uct:7.128 status:200
pid:41 t:1700163031.929 rt:8.990 urt:8.990 uct:7.128 status:200
It turned out that very often information was logged in bursts with exactly the same timestamp, what was even more intriguing was that some of such entries reported the exact same time as an $upstream_request_time or $upstream_connect_time. Let’s say that even if you are keen on paranormal mystery, odds, that’s the moment when the big red light should start blinking. It definitely looks like something deterministic, not random. In the production realm, it was even more interesting; some bursts were connected with each other in some strange arithmetic way - for example:
Let’s define bursts as:
B1, B2, B3 - bursts
B1.TS - timestamp of the burst
B3.urt, B3.uct - upstream_request_time, upstream_connect_time - reported during last burst
then such relation was often noticed:
B1.TS + B3.uct = B2.TS
B1.TS + B3.urt = B3.TS
To better understand such a relation, let’s draw it:

Having a clue that there are extended periods of time when processing for a particular process is stuck, we wanted to know what was going on when processes hung. We used strace to preview what particular system calls were made during such problems. The challenge was to connect to the process when problems occur, but fortunately for us (and less fortunately for our users) we did not wait a long time for the subsequent instability, and we were able to gather strace data. It reveals a large number of futex calls that indicated active waiting for some barer / mutex.
Connecting the dots #
As it was announced earlier, on that stage we have three actors. In order to better understand what was happening under the hood, let’s take a closer look at each of them.
First of all nginx server, it uses an asynchronous event-driven approach to handling connections. It means that a single nginx worker can process a large number of requests simultaneously basically because a significant part of processing a single request happens outside the worker. Instead of actively waiting for a response, the nginx process uses such spare time to handle new incoming requests. Everything works very efficiently as long as each blocking (IO consuming) operation is handled in an asynchronous manner (the control is returned to event-loop). When such a requirement is unmet, the processing pace slows dramatically.
The second actor is the ModSecurity-nginx plugin. Nginx plugins allow extending the logic of the server by adding custom logic. ModSecurity-nginx plugin allows inspecting requests processed by nginx against ModSecurity rules. Such inspection can be considered a CPU-bound operation, so even if it is called in a synchronous manner, it does not break the concept of processing blocking operations asynchronously.
The third one is LMDB, a very efficient mapped DB that allows concurrent reads and exclusive writes. This database was used as a storage for ModSecurity collections in order to share a state of collections between nginx workers. The documentation and source code of this relatively small project were scrutinized many times as well as integration between ModSecurity and LMDB, but there was no suspicion of what could be wrong.
Finally, it turned out that the version of ModSecurity that we scrutinized was from the master branch. Moreover, the master branch contained an improvement related to misusing LMDB exclusive transactions while reading the data. Given that, we had a justified belief that issues came from exclusive transactions. It means that nginx workers probably block on acquiring locks.
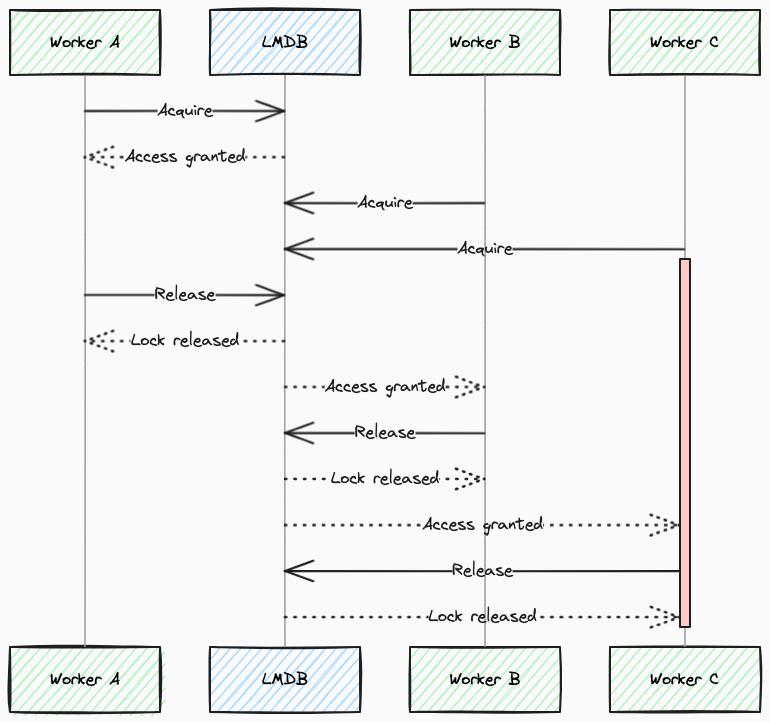
Reproducing the issue in the isolated environment #
To reproduce the issue, we decided to use a technique that we called a fancy name: exaggeration. Reproducing a problem that occurs under high traffic that is handled by powerful servers is not simple on a local workstation. However, in this case, we had some clues and justified hypotheses about what could be wrong and what part we should focus on. Let me explain what exaggeration means when it comes to reproducing a problem. Some sort of problems can be easily noticeable when the probability of the occurrence of rare events is raised to a significant level. If we have different ways to increase such probability, we can use them interchangeably. I am aware that it sounds like theoretical physics, but believe me or not our problems are relatively easier to solve than those worked on by the guys at LHC.
In our case, we were pretty sure that the number of concurrent lookups on a single server to ModSecurity collections is a rare event. So instead of loading a local server in enormous traffic we significantly increased the number of lookups to LMDB that were performed for each processed request.
All below information is based on data that can be gathered from the docker environment that was prepared as an integral part of this article. It is worth mentioning that the environment can be built in one of two modes:
- regular that is way faster when it comes to building process
- profiling that allows revealing the exact point where nginx processes hang based on profiling information from the kernel
I would not like to deep dive into the profiling process based on kernel capabilities, but it is very cumbersome in a containerized environment because it breaks the isolation paradigm. Moreover, it is hard to prepare due to compatibility requirements between host and container libraries, header files and compilers. However, for this particular purpose it was tempting to use limited profiling tools based on eBPF that do not have such restricted requirements.
The first part of the reproducing process is feeding LMDB collections with sample data. When the collections are prepared, we can run performance tests using ab. By increasing the number of lookups against LMDB collections during each request, it is relatively simple to reproduce low performance. Analysis of access logs revealed the bursts mentioned in investigation part.
The more interesting part was finding the exact place that caused hangs. We started from the entry point (for call inspection of the request headers) to ModSecurity from the nginx plugin, namely msc_process_request_headers function. We helped ourselves with a tool trace-bpfcc provided within package bpfcc-tools. Besides all other features, that tool allows logging the exact point in time when a particular function is called and when it is finished. When we analyzed the time spent on such a function, we realized that was the exact place where we should dig deeper:
trace-bpfcc -t  'p:/usr/local/modsecurity/lib/libmodsecurity.so.3.0.6:msc_process_request_headers "start"' \
  'r:/usr/local/modsecurity/lib/libmodsecurity.so.3.0.6:msc_process_request_headers "stop"' \
  'r:/usr/local/modsecurity/lib/libmodsecurity.so.3.0.6:msc_process_logging "stop"' 2>/dev/null

TIME     PID     TID     COMM            FUNC             -
..
3.981139 10842   10842   nginx           msc_process_request_headers start
6.296459 10847   10847   nginx           msc_process_request_headers stop
6.297111 10847   10847   nginx           msc_process_request_headers start
6.309465 10844   10844   nginx           msc_process_request_headers stop
6.310118 10844   10844   nginx           msc_process_request_headers start
6.314868 10842   10842   nginx           msc_process_request_headers stop
6.319024 10840   10840   nginx           msc_process_request_headers stop
6.323392 10839   10839   nginx           msc_process_request_headers stop
6.328587 10837   10837   nginx           msc_process_request_headers stop
6.332937 10843   10843   nginx           msc_process_request_headers stop
6.338358 10841   10841   nginx           msc_process_request_headers stop
6.339536 10841   10841   nginx           msc_process_request_headers start
6.349181 10845   10845   nginx           msc_process_request_headers stop
6.367007 10838   10838   nginx           msc_process_request_headers stop
6.368100 10838   10838   nginx           msc_process_request_headers start
6.522875 10842   10842   nginx           msc_process_logging stop
...
Please pay attention to highlighted lines related to PID=10842. It turned out that the upstream responded within the required time (in the prepared environment, we are able to control the upstream latency by part of the URL path): 6.522875 - 6.314868 ~ 200ms. However, the rest of time: 6.314868 - 3.981139 ~ 2.230s is consumed in msc_process_request_headers, when we search for the access log entry related to this processing we can see:
connection:5824 timestamp:1700222187.657 request_time:2.440 upstream_response_time:2.439 upstream_connect_time:2.235 upstream_header_time:2.438 status:200 request:(GET /users/200/random?arg=unknown HTTP/1.0)
I would not bore you with the whole process of tracking down but go directly to the LMDB mdb_txn_begin function that starts the LMDB transaction. That function is called for each LMDB lookup, so there are way more calls than in previous profiling. However, I prepared a command that allows us to aggregate all time consumed while waiting in that function.
# trace-bpfcc -t 'p:/usr/lib/x86_64-linux-gnu/liblmdb.so.0.0.0:mdb_txn_begin "start"' \
  'r:/usr/lib/x86_64-linux-gnu/liblmdb.so.0.0.0:mdb_txn_begin "stop"' 2>/dev/null | tee /tmp/benchmark.log
# cat /tmp/benchmark.log  | sort -n | awk '{if ($6 == "start") { data[$2] = $1} else { summary += 1000 * ($1 - data[$2]); print $1, $2, 1000 * ($1 - data[$2]) }} END {print "Total time spent on locking: ", summary, "ms,  number of calls: ", calls}'
...
Total time spent on locking: 105891ms number of calls:  4064
As a comparison, we can execute the same profiling on version with a fix. Such a version is also available in a prepared environment.
cat /tmp/benchmark.log  | sort -n | awk '{if ($6 == "start") { data[$2] = $1} else { calls++; summary += 1000 * ($1 - data[$2]); print $1, $2, 1000 * ($1 - data[$2]) }} END {print "Total time spent on locking: ", summary, "ms,  number of calls: ", calls}'
...
Total time spent on locking: 1811.19ms  number of calls:  4064
Fixing the fix #
As I have mentioned before, during the investigation we inspected source code that partially solves the problem. It turned out that the fix merged to master does not work at all with the nginx plugin because of some initialization problems. The PR that fixes the found problem has been merged and released in version 3.0.7 of ModSecurity.
Lessons learned #
Make sure that you inspect the exact version of the source code that you run #
One of the struggles that we faced was scrutinizing the version of ModSecurity that had partially fixed the problem with exclusive read access to LMDB. For sure, we had bad luck that the fix was available in master and not in the last released version that we then used, but at least we can confirm that the devil is in the details.
Instrumentation overhead #
When using such low level profiling methods you have to bear in mind that approach is quite invasive. It means that such observation impacts the observed process. It implies that it is hard to distinguish if we are observing root problems or just a consequence of harnessing very heavy instrumentation. So, it is risky to draw conclusions from such observations.
Verify your assumptions #
Our lack of understanding of how the particular phases of processing requests are computed led us to the false assumption that we could compute approximate
ModSecurity overhead by using simple arithmetic: request time - upstream time.

It was one of the biggest mistakes that hindered revealing the truth. It turned out that part of ModSecurity processing was included into upstream time, so the red part on above diagram also includes ModSecurity processing that is not part of establishing connection. As a form of self-punishment, we extended the nginx-ModSecurity plugin in such a way that it allows measuring the overhead of each ModSecurity phase in a reliable way.
Log timestamps #
It may seem redundant because many logger collectors by default add their own timestamp of the moment when log entries are received in the collector. However, having a timestamp from the moment when the log is produced (without any delays) is crucial to reveal suspicious patterns/hangs on the producer side that can not be observed if timestamps are affected by random lags.
Do (not) abuse undocumented behavior #
One of the reasons that we faced this issue was abusing usage of ModSecurity collections. In regular and documented usage such collections are considered to be simple key-value storage. We discovered that under each key, we are able to store a list of values instead of a single value. If you consciously scanned the provided repository (especially ModSecurity rules) you could probably find a way to simulate a situation where multiple values are fetched while reading a single key. Let’s look at a rule that is available in the repository
SecRule &REQUEST_HEADERS:x-set-sample "@eq 1" "phase:1,setvar:global.sample%{REQUEST_HEADERS:x-set-sample}=%{REQUEST_HEADERS:x-set-sample},log,deny,status:403,id:50,msg:'value of sample header is blocked',tag:'priority:1',tag:'action:deny'"
If we call above rule with x-set-sample header with subsequent values 1, 2, 3. We can do that by making HTTP requests as below:
workstation # docker-compose exec nginx-before-fix bash
nginx-with-lmdb # curl -I -H'x-set-sample: 1' localhost
nginx-with-lmdb # curl -I -H'x-set-sample: 2' localhost
nginx-with-lmdb # curl -I -H'x-set-sample: 3' localhost
Then, we can expect that there will be stored three key-value pairs:
- globals[sample1]=1
- globals[sample2]=2
- globals[sample3]=3
Indeed, when we try to read LMDB in a very naive approach, values are stored the way we expect. We can see something like that:
nginx-with-lmdb # strings /tmp/modsec-shared-collections
sample::::sample11
sample::::sample22
sample::::sample33
The following rule that is interesting is supposed to check if a value under a particular key is equal to a query param. Basically, if the request contains query parameter arg=1, then we check if the value in the collection global, under the key sample is also “1”. If the condition is met then the request will be blocked, which means that 403 status code will be returned.
SecRule ARGS_GET ".*" "chain,phase:1,log,capture,deny,status:403,id:1001,msg:'value of param %{TX.0} is blocked',setvar:tx.param=%{TX.0}"
    SecRule global.sample "@streq %{tx.param}" "t:none"
You may be confused why we are reading the key sample that was never set. Let’s look what happens when we try to make a request with value 1 and -1. As I described earlier, our intention was to check if global[sample] == 1.
nginx-with-lmdb  # curl -I "http://localhost/users/200/random?arg=1"
HTTP/1.1 403 Forbidden
Server: nginx/1.22.0 (Ubuntu)
Date: Fri, 17 Nov 2023 10:58:39 GMT
Content-Type: text/html
Content-Length: 162
Connection: keep-alive
nginx-with-lmdb

nginx-with-lmdb  # curl -I "http://localhost/users/200/random?arg=-1"
HTTP/1.1 200
Server: nginx/1.22.0 (Ubuntu)
Date: Fri, 17 Nov 2023 10:58:42 GMT
Content-Type: application/json
Content-Length: 79
Connection: keep-alive
Quite interesting? It turns out that the match is fulfilled for value “1”, and surprisingly there is a log that gives us an insight:
nginx-with-lmdb  # tail -5 /var/log/nginx/modsec_audit.log
---TL9qTmAS---H--
ModSecurity: Access denied with code 403 (phase 1). Matched "Operator `StrEq' with parameter `' against variable `GLOBAL:sample::::sample1' (Value: `1' ) [file "/etc/nginx/rules/rules.conf"] [line "32"] [id "1001"] [rev ""] [msg "value of param 1 is blocked"] [data ""] [severity "0"] [ver ""] [maturity "0"] [accuracy "0"] [hostname "127.0.0.1"] [uri "/users/200/random"] [unique_id "1700218719"] [ref "o0,1v27,1"]

---TL9qTmAS---Z--
As you can see, internally ModSecurity read the value that was stored under the key sample1 instead of sample. The same works for each key with matching prefix.
To wrap up this somewhat too long digression, we abused undocumented behavior on purpose, and it increased the time it took to fetch data. Moreover, such fetching was redundant and nonsense because after fetching all those values we check only if the list contains a particular value. Due to the increased time of exclusive locks (acquired for the whole time of fetching data), the problem started to be noticeable. On the other hand, if we had not abused it, we would unconsciously still be using buggy code that slowly degrades efficiency.
