
Postmortem — why Allegro went down
We messed up. On July 18th, 2018, at noon, Allegro went down and was unavailable for twenty minutes. The direct cause was a special offer in which one hundred Honor 7C phones whose regular price is around PLN 850 (about € 200), were offered at a price of PLN 1 (less than € 1). This attracted more traffic than we anticipated and at the same time triggered a configuration error in the way services are scaled out. This caused the site to go down despite there being plenty of CPUs, RAM, and network capacity available in our data centers.
In order to make up for the issues and apologize, we made it possible to finish the transaction afterwards to buyers who managed to buy the phone at the low price but whose transactions were aborted as the system went down.
But we believe that we also owe our customers and the tech community an explanation of how the crash came about and what technical measures we are putting in place in order to make such events less likely in the future. We prepare internal postmortems after any serious issue in order to analyze the causes and learn from our mistakes. This text is based on such an internal postmortem, prepared by multiple people from the teams that took part in dealing with the outage.
Architecture overview #
First of all, let’s start with an overview of our architecture. As you probably already know from our blog, our system is based on microservices which run in a private cloud environment. In the typical case of a user searching for an offer, clicking on it to view details, and then buying, following major services are involved:
- Listing — prepares data related to item listing (search result) pages
- Search — responsible for low-level search in offers, based on keywords, parameters and other criteria
- Transaction — allows items to be bought
- Opbox — responsible for frontend rendering of the data returned by backend services
- Item — service for frontend rendering of item pages
Outage timeline #
The special offer was to start at noon sharp, and a direct link to its item page had been published before. At 11:15 we manually scaled out Listing service in order to be prepared for increased incoming traffic.
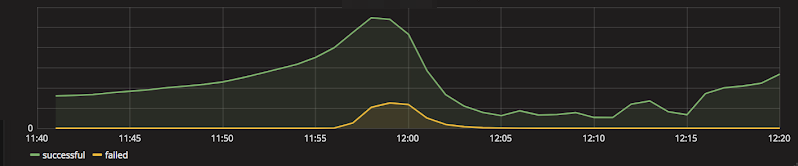
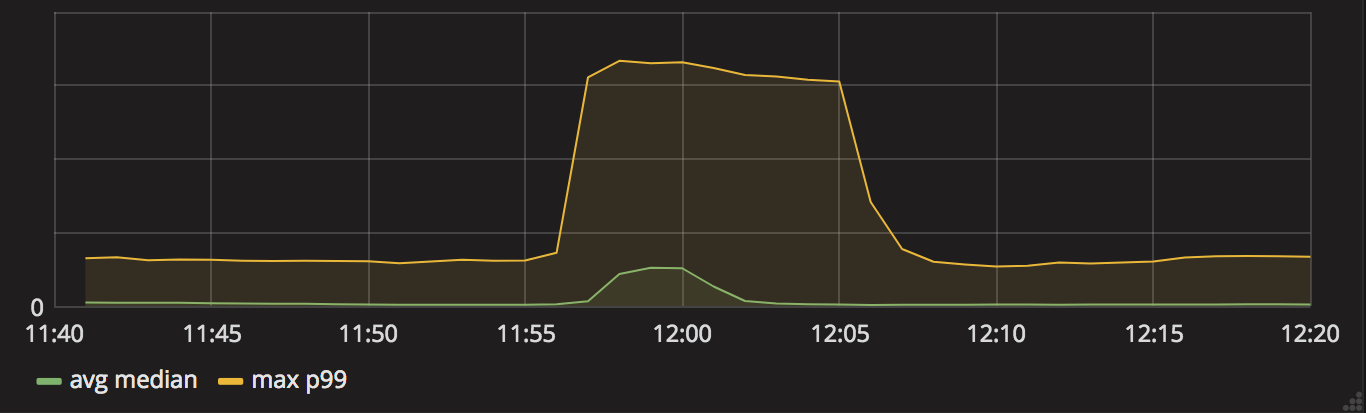
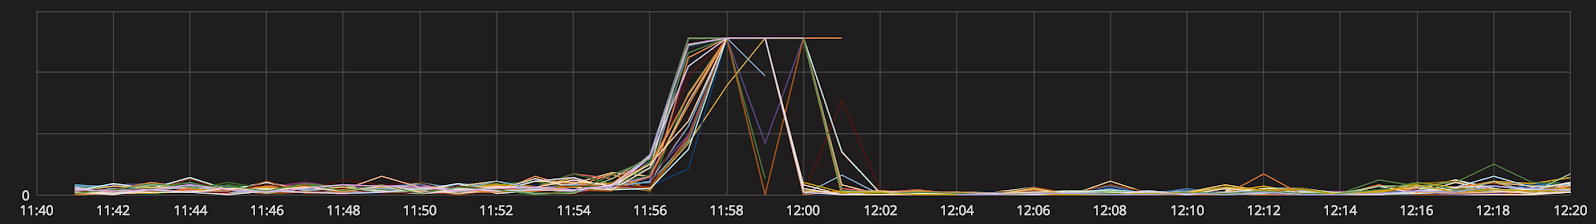
At 11:50, traffic to the major services was already 50% higher than the day before at the same time of day. At 11:55, further traffic increase caused response times of major services to rise, forcing us to scale out these services. A minute or two later, response times from Search and Listing services rose even more, forcing further scaling.
By 11:58, almost all resources in the part of the cluster provisioned for these services had been reserved even though only a fraction of the cluster’s capacity (or even that particular compartment) was actually used. When an application is deployed to our cloud, it declares the amount of resources such as processor cores and memory which it needs for each instance. These resources are reserved for a particular instance and can’t be used by others even if the owner is not really consuming them. Some services share their cluster space with others while others have separate compartments due to special needs.
As we later found out, due to a misconfiguration, some services reserved much more resources than they actually needed. This lead to a paradoxical situation in which there were plenty of resources available in the cluster but since they were reserved, they couldn’t be assigned to any other services. This prevented more instances from starting despite resources being there. Some other compartments within the cluster were not even affected at all, with lots of CPUs idling and tons of RAM laying around unused.
Seconds before noon, the price of the special offer was decreased to PLN 1 in order to ensure that at 12:00 sharp it would already be visible in all channels, and the first sales took place.
Also just before noon, traffic peaked at 200%-300% of the traffic from previous day, depending on service. At this stage, traffic was at its highest but due to excessive resource reservations, in some parts of the cluster we could not use available CPUs and RAM for starting new service instances. Meanwhile, the frontend service, Opbox, was starting to fail. This caused a decrease in traffic to the backend services. It was still quite high, though, and autoscaler started to spin up new instances of Search service. We manually added even more instances, but the resource reservations created previously prevented us from scaling up as far as to decrease response times significantly.
Increased response times caused some Opbox instances to not report their health status to the cluster correctly and at 12:05 the cluster started killing off unresponsive instances. While automated and manual scaling efforts continued, before 12:15 we started adding more resources to the cluster. At the same time, we started shutting down some non-critical services in order to free CPU and memory. Around 12:20, the situation was fully under control and Allegro became responsive again.
Analysis #
What is going on inside a service which experiences traffic higher than it can handle with available resources? As response times increase, the autoscaler tries to scale up the service. On the other hand, instances whose health endpoint can’t respond within a specified timeout, are automatically shut down. During the outage, autoscaler did not respond quickly enough to rising traffic and we had to scale up manually. There were also some bad interactions between the autoscaler scaling services up and the cluster watchdog killing off unresponsive instances.
Excessive resource reservations were a major cause of problems since they prevented more instances from being started even though there were still plenty of resources available. As the probably most important action resulting from this postmortem, we plan to change the cluster’s approach to reserving resources so that there is less waste and resources are not locked out of the pool if they are not really used.
Apart from the obvious resources of the cluster: CPU and RAM, another resource which can become saturated are the connection pools for incoming and outgoing network connections as well as file descriptors associated with them. If we run out of them, our service becomes unresponsive even if CPU and RAM are available, and this is what happened to some of the backend services during the outage. By better tuning the configuration of thread and connection pools as well as the retry policies, we will be able to mitigate the impact of high traffic the next time it happens.
In most cases, requests which time out, are repeated after a short delay. Under normal conditions, the second or third attempt usually succeeds, so these retries can often fix the situation and allow a response to still be delivered to the end user. However, if the whole cluster is maxed out, retries only increase the load while the whole request fails anyway. In such a situation, a circuit breaker should prevent further requests, but as we found out during postmortem analysis, one of the circuit breakers between our services was not correctly configured: the failure threshold for triggering it was set to a high value which we didn’t reach even during such a serious surge in traffic. Apart from fixing this, we are also adding an additional layer of circuit breakers directly after the frontend service.
The role of rate limiters is to cut off incoming traffic which displays suspicious patterns before it even enters the system. Such rate limiters did in fact kick in and were the cause of many “blank pages” seen by our users during the outage. Unfortunately, the coverage of the site by rate limiters was not complete, so while some pages were protected very well, others were not. The “blank page” had an internal retry, so a user looking at such a page was actually still generating requests to the system once in a while, further increasing the load. On the other hand, upon seeing that the site was broken, some users tried to manually refresh the pages they were viewing or to enter allegro.pl into the address bar and searching for the phone’s name, thus generating even more search requests manually.
Another takeaway was the observation that new Opbox instances had issues while starting under high load. Newly started instances very quickly reached “unresponsive” status and were automatically killed. We will try out several ideas which should make the service start up faster even if it gets hit with lots of requests right away.
Finally, by introducing smart caches, we should be able to eliminate the need for many requests altogether. Due to personalisation, item pages are normally not cached and neither is the data returned by backend services used for rendering those pages. However, we plan to introduce a mechanism which will be able to tell backend services to generate simplified, cacheable responses under special conditions. This will allow us to decrease load under heavy traffic.
Closing remarks #
Apart from the need of introducing the improvements mentioned above, we learned a few other interesting things.
First off, we certainly learned that traffic drawn in by an attractive offer can outgrow our expectations. We should have been ready for more than we were, both in terms of using cluster capacity effectively and in terms of general readiness to handle unexpected situations caused by a sudden surge in traffic. Apart from technical insights, we also learned some lessons on the business side of things, related to dealing with attractive offers and organizing promotions, for example that publishing a direct link to the special offer ahead of time was a rather bad idea.
Interestingly enough, the traffic which brought us down, was in large part bots rather than human users. Apparently, some people were so eager to buy the phone cheaply that they used automated bots in order to increase their chances of being in the lucky hundred. Some even shared their custom solutions online. Since we want to create a level playing field for all users, we plan to make it harder for bots to participate in this kind of offers.
Even though it may have looked as if the site had gone down due to an exhaustion of resources such as processing power or memory, actually plenty of these resources were available. However, an invalid approach to reserving resources made it impossible at one point to use them for starting new instances of the services which we needed to scale out.
I think that despite the outage taking place, the way we handled it validated our approach to architecture. Thanks to the cloud, we were able to scale out all critical services as long as the resource limits allowed us to. Using microservices, we were able to scale different parts of the system differently which made it possible to use the available cluster more effectively. Loose coupling and separation of concerns between the services allowed us to safely shut down those parts of the system which were not critical in order to make room for more instances of the critical services.
Our decentralized team structure was a mixed bag, but with advantages outweighing disadvantages. It certainly lead to some communication overhead and occasional miscommunication, but on the other hand, it allowed teams responsible for different services to act mostly independently, which increased our reaction speed overall. Note, that “decentralized team structure” does not mean “free for all”. In particular, during an outage, there is a formal command structure for coordinating the whole effort, but it does not mean micromanagement.
We know that Allegro is an important place for our customers, and every day we work hard to make it better. We hope that the information contained in this postmortem will be interesting for the IT community. We are implementing actions outlined in a much more detailed internal report in order to make such events less probable in the future. Even in failure there is opportunity for learning.
Allegro Engineering Team