
How the Garbage Collector Works in Go and How It Affects Your Programs
Have you ever wondered what happens with the variables you define in your Golang (Go) programs? Do they exist forever, or are they recycled at some point? Where do they live in memory and how are they managed?
In this article, we will explore together how the garbage collector (GC) works in Go and how it can affect the performance of your programs. This article is not only for Go developers. You don’t need to know how memory allocation works in this language, either: this knowledge is helpful, but not required. Our goal is to give you a concise overview of how Go’s GC works under the hood, what tuning options you have, and, importantly, how it can affect the latency and throughput of your applications. I will explain all the terms that you need to know to understand this topic.
Please note that this is not a complete guide or tuning tutorial, but more of a practical introduction that will hopefully make you curious enough to investigate further and experiment with Go’s GC on your own.
The content of this article refers to the Go 1.19+ version described in the documentation. Let’s get started!
What is Garbage Collection? #
Physical memory is a finite resource and because of that, it must be managed carefully and recycled in order to avoid running out of it while executing a program. Garbage collection is a form of automatic memory management. It attempts to reclaim memory occupied by your program (variables, objects, etc.) that is no longer in use by the program. These items are referred to as “garbage”. Even though the work done by the GC may feel like non-existent, because it is done in the background, it is actually very important for the developers because it allows them to focus on writing code without the need of doing manual memory-related work.
Before We Dive Deeper #
Before we dive into the details of how Go’s garbage collector works, I would like to explain key terms that are essential to understanding the topic.
- A pointer is a memory address that references a value within an object.
This naturally includes explicit Go pointers
(*T), but also includes parts of built-in Go values like strings, slices, maps and interfaces. All of them internally contain pointers that GC must trace. - Together, objects and pointers that connect them, form the object graph. To identify live memory, the GC starts from program roots (like stack variables and global variables) and traverses (“walks”) the object graph, following pointers, to discover which objects are reachable. The process of “walking” is called scanning. If an object can be reached from a root, it is considered reachable (“live”) and will not be collected by the GC. Otherwise, is is considered unreachable (“dead”) and its allocated memory will be reclaimed.
Go’s GC: The Basics #
The Go runtime automates memory management, which helps prevent memory leaks and many types of bugs. However, this automation comes at the cost of GC pauses and CPU overhead.
Go’s garbage collector primarily follows a tricolor mark-and-sweep algorithm that consists of three main phases:
- Mark phase — the GC starts from “root” references, such as the previously mentioned global and stack variables and marks all objects that it can reach. This is done incrementally and concurrently with your program. I will explain these terms in next section.
- Sweep phase — once marking is complete, the GC sweeps through the heap and frees memory taken by unmarked objects.
- Stop-the-world points — although most of the work happens concurrently, there are short stop-the-world (STW) pauses to coordinate phases, e.g., to start marking and to finish sweeping. These pauses typically last microseconds to low milliseconds, so in small, personal projects they won’t matter, but for low-latency applications (like HFT or Allegro), this might be crucial.
Tricolor Mark-and-Sweep — What Does It Mean? #
The tricolor mark-and-sweep algorithm is a way to classify objects in the heap into three colors: white, gray, and black.
- White objects are those that have not been marked yet, meaning they are not reachable from the root references. At the beginning of the GC cycle, all objects in the heap are white.
- Gray objects are those that have been marked, but their references have not been fully explored yet.
- Black objects are those that have been marked and all their references have been explored.
In the previous section, I mentioned two key features of Go’s GC: incremental and concurrent. What do these terms mean in practice? Marking and sweeping are done concurrently with the program execution, which means that the GC runs alongside your application. Your program doesn’t stop while the GC is running, but there are short pauses to coordinate the phases. Incremental means that the Go’s GC works in small chunks.
Let’s take a look at the diagram below to visualize how the algorithm works:
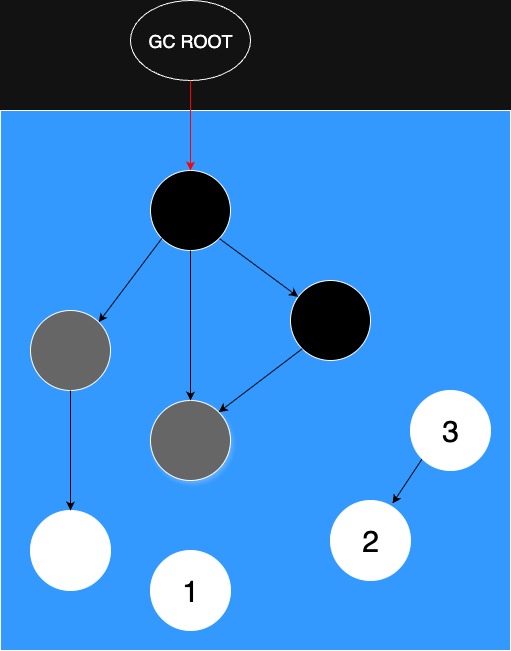
In the diagram above, we can see that white objects were not marked yet because they are not reachable from the root references. The gray objects were marked, but their references have not been fully explored yet. The black objects were marked and all their references have been explored.
At the end of the algorithm nodes labeled as 1, 2 and 3 will be treated as garbage and the memory occupied by them will be reclaimed.
Stack vs Heap: Not All Values are Managed by The GC #
In Go, there are two main types of memory allocation: stack and heap.
Go uses optimizations during compilation and at runtime to ensure that the code is efficient.
A key memory optimization is escape analysis, which determines whether an object should be allocated on the stack or the heap.
You can observe this optimization during the compilation phase by adding the -gcflags=-m flag.
(You can add additional -m to the flag to print more detailed information.)
-
Stack — local variables that do not escape the function are being put on the stack. The memory is tied to the function call’s lifetime (lexical scope) and is automatically reclaimed when the function returns.
-
Heap — if the object escapes the function’s scope (e.g., it is returned or referenced by a pointer that outlives the function), it will be allocated on the heap.
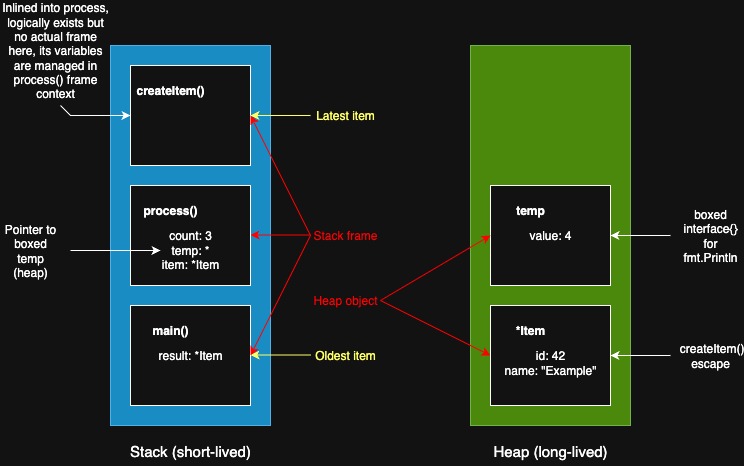
Let’s visualize this with a simple example:
package main

import "fmt"

type Item struct {
    id   int
    name string
}

func createItem(id int) *Item {
    item := &Item{
        id:   id,
        name: "Example",
    }
    return item
}

func process() *Item {
    count := 3
    temp := count + 1
    item := createItem(42)
    fmt.Println(temp)
    return item
}

func main() {
    result := process()
    fmt.Println(result)
}
After the createItem function exits, its local variables will escape to the heap because they are returned as pointers.
The same happens in the process function, where the item variable also escapes to the heap.
However, the count variable is local to the process function and do not escape,
so they will be allocated on the stack. So why did the temp local variable escape to the heap?
That’s because it is passed as an argument to the fmt.Println function, which uses variadic arguments (interface{}),
and it may be perceived as heap allocation.
When main ends, its stack frame and result will disappear.
At this point, if there are no other references to the *Item, then the object on the heap will be unreachable.
It will remain there until the next GC cycle, when it will be marked as dead and its memory will be reclaimed.
The whole process can be seen by running go build -gcflags="-m -m" main.go command:
# command-line-arguments
./main.go:10:6: can inline createItem with cost 12 as: func(int) *Item { item := &Item{...}; return item }
./main.go:18:6: cannot inline process: function too complex: cost 111 exceeds budget 80
./main.go:26:6: cannot inline main: function too complex: cost 141 exceeds budget 80
./main.go:21:20: inlining call to createItem
./main.go:22:13: inlining call to fmt.Println
./main.go:28:13: inlining call to fmt.Println
./main.go:11:10: &Item{...} escapes to heap:
./main.go:11:10:   flow: item = &{storage for &Item{...}}:
./main.go:11:10:     from &Item{...} (spill) at ./main.go:11:10
./main.go:11:10:     from item := &Item{...} (assign) at ./main.go:11:7
./main.go:11:10:   flow: ~r0 = item:
./main.go:11:10:     from return item (return) at ./main.go:15:2
./main.go:11:10: &Item{...} escapes to heap
./main.go:22:14: temp escapes to heap:
./main.go:22:14:   flow: {storage for ... argument} = &{storage for temp}:
./main.go:22:14:     from temp (spill) at ./main.go:22:14
./main.go:22:14:     from ... argument (slice-literal-element) at ./main.go:22:13
./main.go:22:14:   flow: fmt.a = &{storage for ... argument}:
./main.go:22:14:     from ... argument (spill) at ./main.go:22:13
./main.go:22:14:     from fmt.a := ... argument (assign-pair) at ./main.go:22:13
./main.go:22:14:   flow: {heap} = *fmt.a:
./main.go:22:14:     from fmt.Fprintln(os.Stdout, fmt.a...) (call parameter) at ./main.go:22:13
./main.go:21:20: &Item{...} escapes to heap:
./main.go:21:20:   flow: item = &{storage for &Item{...}}:
./main.go:21:20:     from &Item{...} (spill) at ./main.go:21:20
./main.go:21:20:     from item := &Item{...} (assign) at ./main.go:21:20
./main.go:21:20:   flow: ~r0 = item:
./main.go:21:20:     from ~r0 = item (assign-pair) at ./main.go:21:20
./main.go:21:20:   flow: item = ~r0:
./main.go:21:20:     from item := ~r0 (assign) at ./main.go:21:7
./main.go:21:20:   flow: ~r0 = item:
./main.go:21:20:     from return item (return) at ./main.go:23:2
./main.go:21:20: &Item{...} escapes to heap
./main.go:22:13: ... argument does not escape
./main.go:22:14: temp escapes to heap
./main.go:28:13: ... argument does not escape
Go’s GC prioritizes cleaning up after short-lived objects, though it does not have explicitly generational GCs like JVM’s G1.
Latency and Throughput #
As I mentioned earlier, Go’s garbage collector is designed to be concurrent and to minimize synchronization pauses. However, it still introduces microsecond to low millisecond range latency and consumes CPU resources. Garbage collection competes with your program for CPU cycles. It spends most of its time marking and scanning objects to figure out what is still alive. More frequent garbage collections mean more CPU is devoted to this work, which could otherwise be used by your application. Concurrent tracing adds complexity to the GC, as it continues to modify the object graph (new variables may be created while the program is running). In the meantime, the GC has to remain consistent (state of objects may change during the GC cycle) and synchronize with other goroutines performing graph traversal.
In general, this means that:
- more pointers mean more work
- deep or pointer-rich structures like trees or linked lists make concurrent tracing harder
- if the GC runs too often, CPU cycles are wasted on GC work instead of your application logic
- if the GC runs too infrequently, the heap grows larger, which can lead to out-of-memory (OOM) errors
So what’s the solution? How can we tune the GC to be balanced?
Tuning #
Go offers some tools in the runtime package to help you tune the garbage collector and
investigate your program needs. I won’t cover all options (like very popular GOMAXPROCS which sets the maximum number of CPUs that can be executing simultaneously), but I will focus on the most useful ones.
Unfortunately, there is no one-size-fits-all solution that you can implement in your program. Every application should be treated individually, and you, as a code maintainer,
should analyze the needs for resources and tune the GC accordingly. In the GC documentation there is a section with interactive
charts that visualize heap growth percentage that triggers the next GC cycle. I won’t copy-paste them here, but I encourage you to check it out.
Setting GOGC #
By setting the heap growth percentage that triggers the next GC cycle, we have practical control over GC behavior. It is often your first tool for tuning memory vs CPU.
It can be done either by setting the GOGC=<value> environment variable or
by calling debug.SetGCPercent(<value>) function in your code.
I will now explain how changing the <value> impacts the GC behavior:
GOGC=100— (default) means that the GC runs when the heap has grown by 100% since the last collectionGOGC=200— less frequent collections, higher memory footprint, lower CPU GC loadGOGC=50— more frequent collections, lower memory footprint, higher CPU GC load
Using GODEBUG #
For deeper diagnostics, there is GODEBUG environment variable, which offers flags such as:
- gctrace=1 — prints GC activity to stderr, showing heap sizes, pause times, and CPU utilization
- gcstoptheworld=1 — forces the GC to fully stop-the-world for testing purposes
- madvdontneed=1 — changes how Go releases memory back to the OS.
For example, running
GODEBUG=gctrace=1 ./myapp
will show lines like:
gc #1 @0.025s 3%: 0.012+0.67+0.010 ms clock, 0.050+0.24/0.80/0.90+0.040 ms cpu, 4->4->2 MB, 5 MB goal, 4 P
The format of this output changes with every version of Go, but you will always see information about GC phases and various heap sizes during the garbage collection cycle.
Summary #
In this article, I have covered the basics of how garbage collection works in Go. I included some details about the algorithm used by the GC. Additionally, I provided insights into how it can affect the performance of your programs. When I started coding, I didn’t care much about memory management and tuning the resource limits. However, as I started working on larger projects, either on my personal ones or at Allegro, I realized how such thing may be important.
Bibliography #
- Go GC Guide — documentation
- How does garbage collection work in Go? How to minimize memory leaks in a high-load application?
- Why Go’s Garbage Collection is a Game Changer
- Exploring the Inner Workings of Garbage Collection in Golang : Tricolor Mark and Sweep
- A whirlwind tour of Go’s runtime environment variables
- All charts were made using drawio