
The noisy JIT Compiler
This article is a case study of how we improved stability in our critical application. It’s mostly a technical analysis of what happens in fresh Java based instance, how JIT Compiler toyed with us at application start and how we learned to control it.
Background #
We proudly own a user facing application. The traffic is fairly high - a few thousands RPS, and to serve requests we need to obtain data from a few services and databases - meaning - it’s not that simple. The service itself is written mostly in Kotlin. It’s well tested, although we would love to see our tests just a bit faster. But one thing you can say about the service, and I hope my team will agree, it’s an entertaining service, and you can learn a lot in terms of microservices in real life.
But let’s get down to business, we started to notice some worrying behaviour, our favourite app started to face problems.
The Spikes #
Application start was never perfect. Once a new instance registers in k8s engine as healthy application it will open up on user traffic, and for just started application it’s not an easy task. It’s started with spikes on response times, every time we deployed a new version, and we do it frequently, at least once a week, we observed timeouts resulting from overpassing response time threshold.
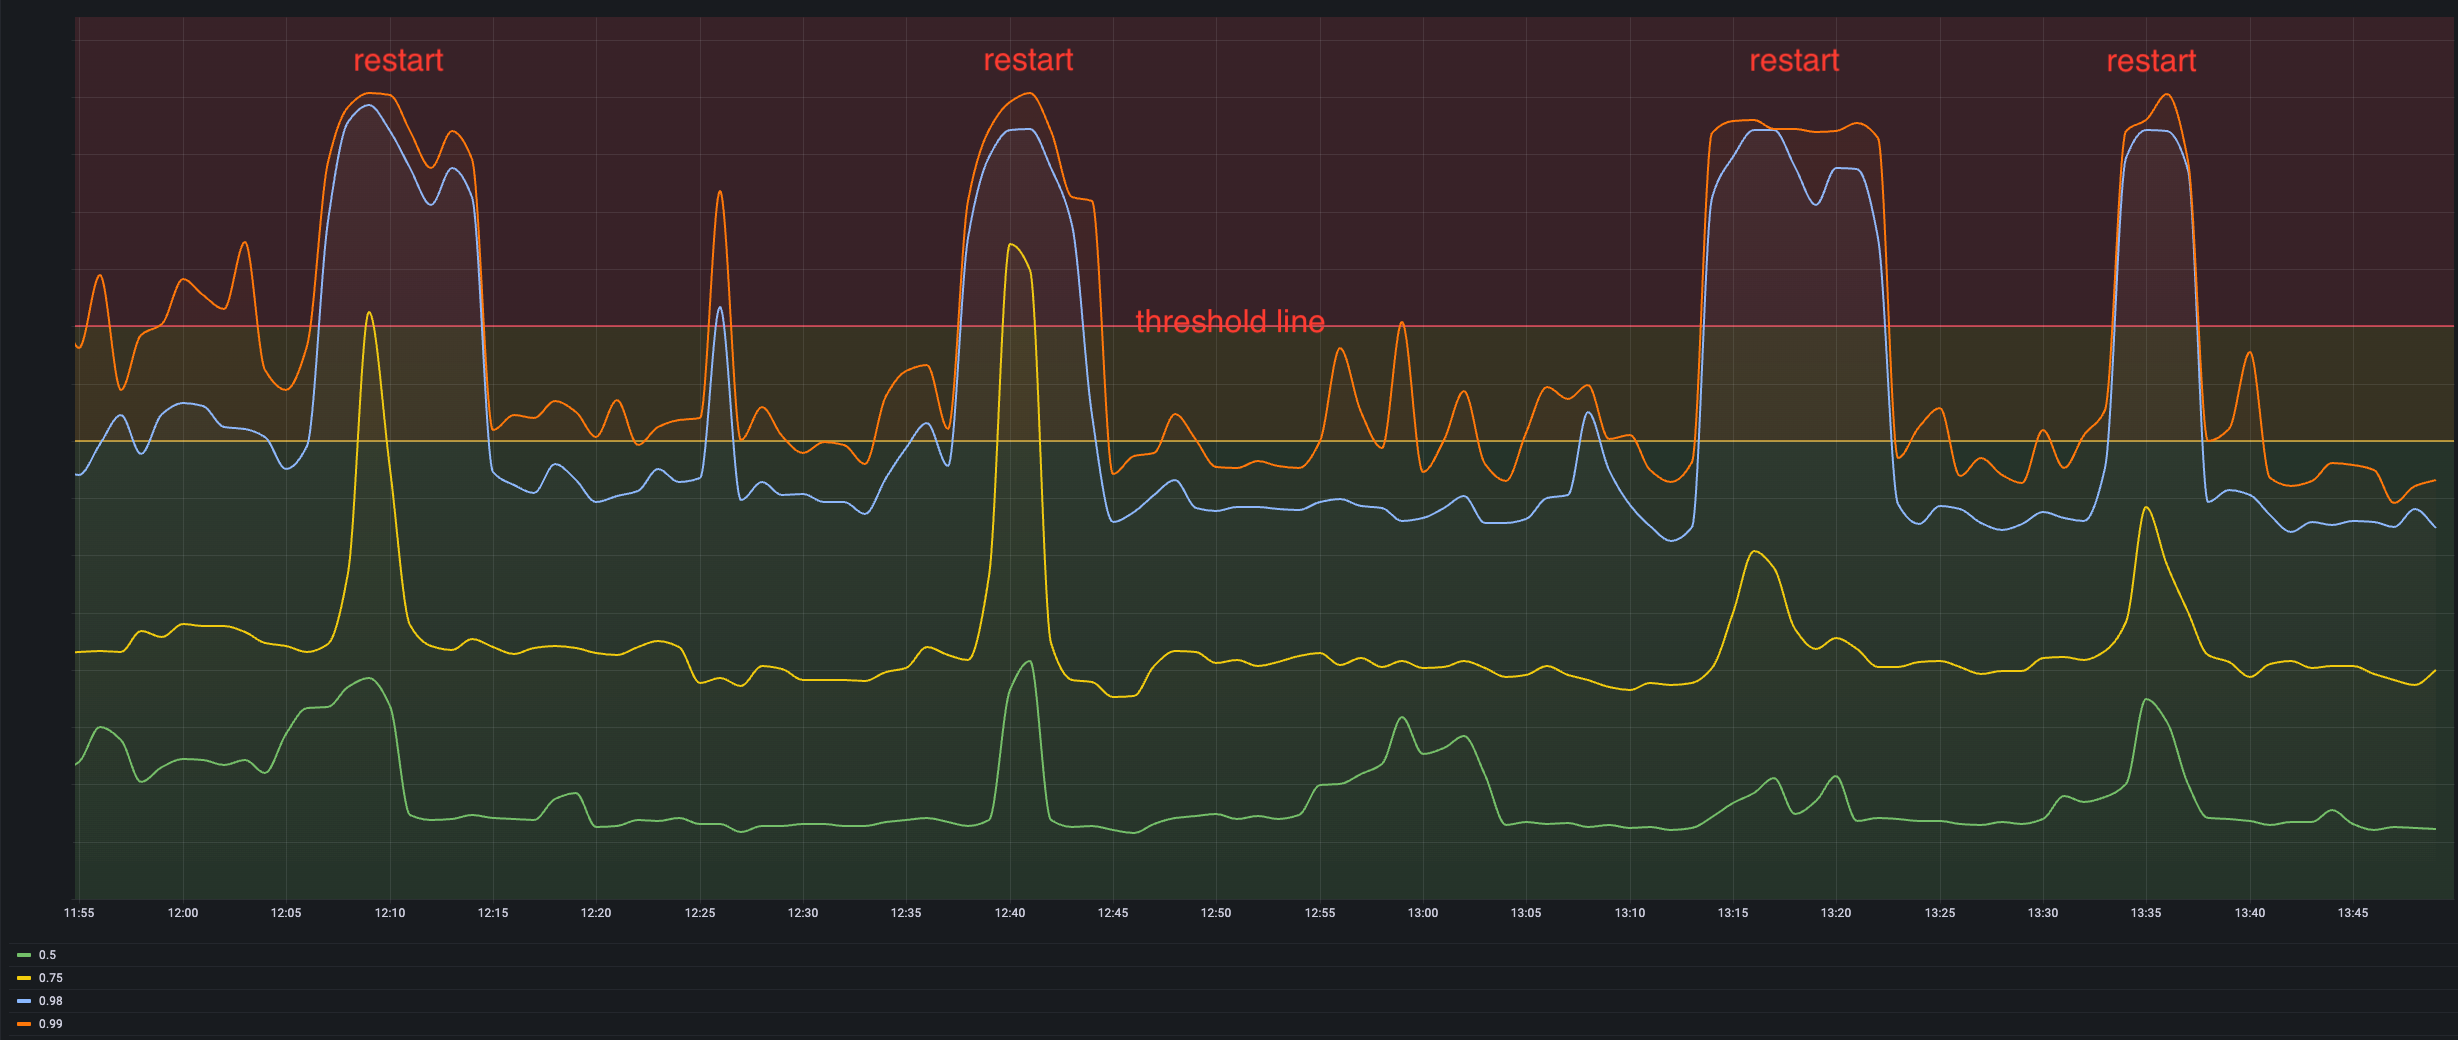
Response times at P99 & P98 were clearly above timeout threshold. Ok, let’s do spike and check what’s going on. A sprint later we found in logs a problem with related service. It could be slow to respond, easy work, small tuning, let’s check the results! It helped… a bit, but the problem remains, and actually it’s growing over time, and we don’t know why.
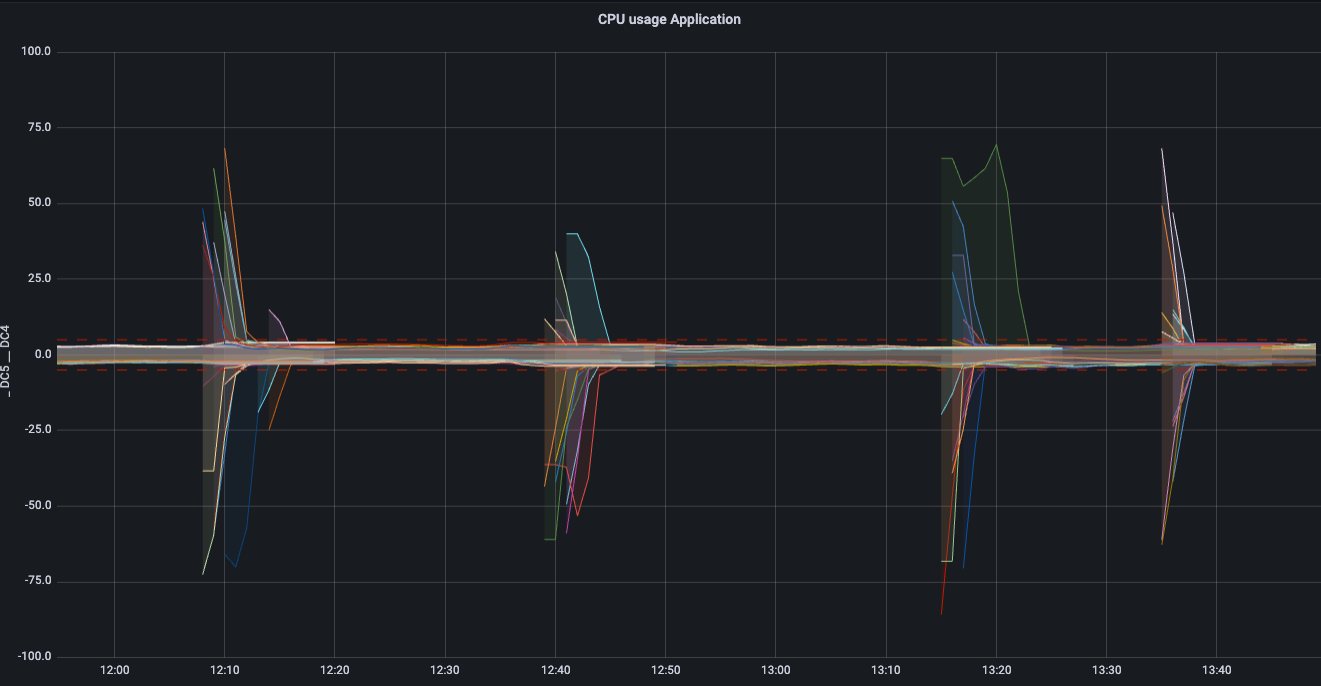
We realized how serious it was when we checked CPU spikes at application start. Application reserves 5 CPUs, and usually uses around 2-3 CPUs, while at start, for very short period of time it could consume 20, 50 and even 75 CPUs! When you count a dozen instances that we have, it’s a massive amount of CPUs, actually influencing other services as we started to compete for same shared hardware resources.
It started to be a pain, so we reacted immediately.
Diagnostics #
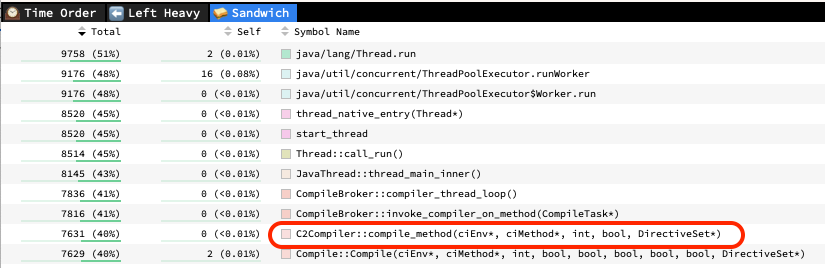
At Allegro we have easy access to diagnostic tools for our services. Thread dump, heap dump, flame graph - it’s all simple to use. We started with a thread dump. We have a few major thread pools in the app, and at start they seem strangely occupied, and the execution takes much more time. Let’s check flamegraph where we spend most of the time. Bingo! JIT compiler occupies 40% of time on CPU, it has to be connected!
What is Jit compiler? #
What actually is Just-In-Time(JIT) compiler? Java Virtual Machine collects statistics at runtime of how many times given code was executed. When it exceeds threshold it will recompile code (typically bytecode or kind of VM instructions) into native instruction set optimized for given CPU. It can have a major impact on application performance, at a price of recompilation time. JIT compiler consists of two major groups, so called C1 & C2 compiler threads. Those come from old days when we differentiate between client and server implementations. C1 was a client compiler, while C2 a server compiler. Today we simply use them both. But let’s go back to performance, one-time precomputation in exchange for eternal performance sounds like a great deal, but it would be good to reduce the initial 20 / 50 CPU usage, lets deep dive into the problem.
C2 compiler deep dive #
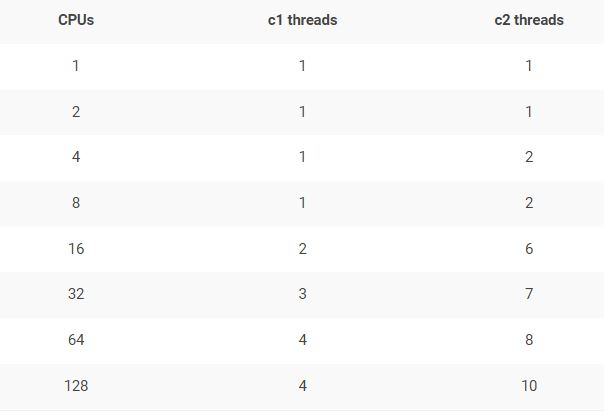
Our application reserves 5 CPUs, and according to spec, it should contain one C1 thread & two C2 threads. I can imagine those running at 100% burning 3 CPUs, but it’s far from those 20 / 50 CPU, something is wrong.
Let’s check thread dump, what our app actually does. After a short analysis, we’ve found that there are 76 threads stacked at single method - _finishString from ReaderBasedJsonParser. Short sample from file you can see below:
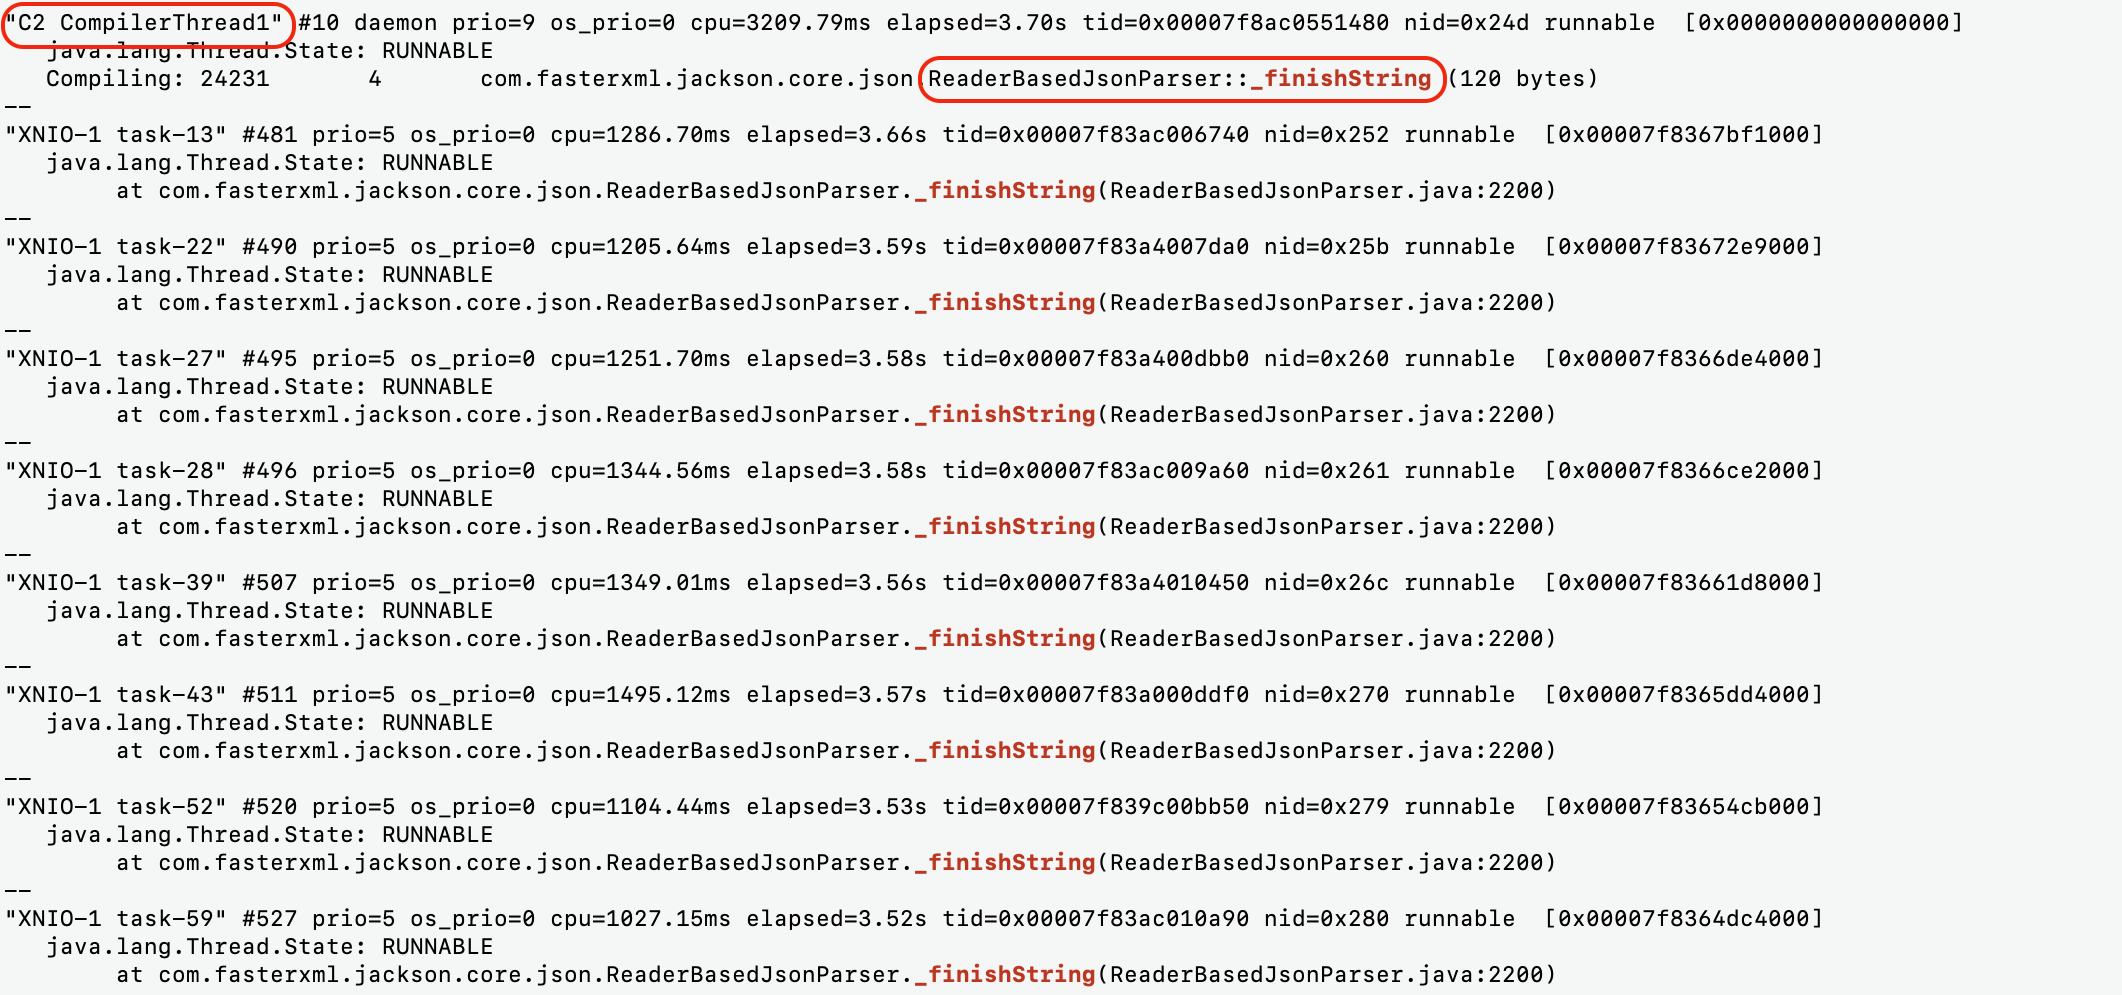
What’s most important from this sample is the C2 compiler thread, it’s the key for our mystery. Now, let’s put all the pieces together, what is actually going on in the application.
- We start the application.
- We allow k8s to probe healthcheck endpoint and at some point app is marked as Running.
- User traffic enters the app.
- In seconds, JVM decides to recompile different parts of code.
- Two C2 threads work 100% to recompile code as pointed by JVM.
- When given function is being recompiled, threads are simply waiting for recompiled version, consuming resources.
- Neither users nor k8s are aware that this particular instance is massively recompiling code. Until it’s finished it might be slow to respond.
- The application experiences multiple micro freezes, until the majority of recompilation is done.
Optimizations #
Let’s try to verify this theory and add more ‘juice’ to the JIT compiler. From default 2 threads for C2 compiler, we moved to 8 threads using -XX:CICompilerCount flag. So far, every restart was causing a deep drop in app SLA, with 8x threads it’s significantly faster.
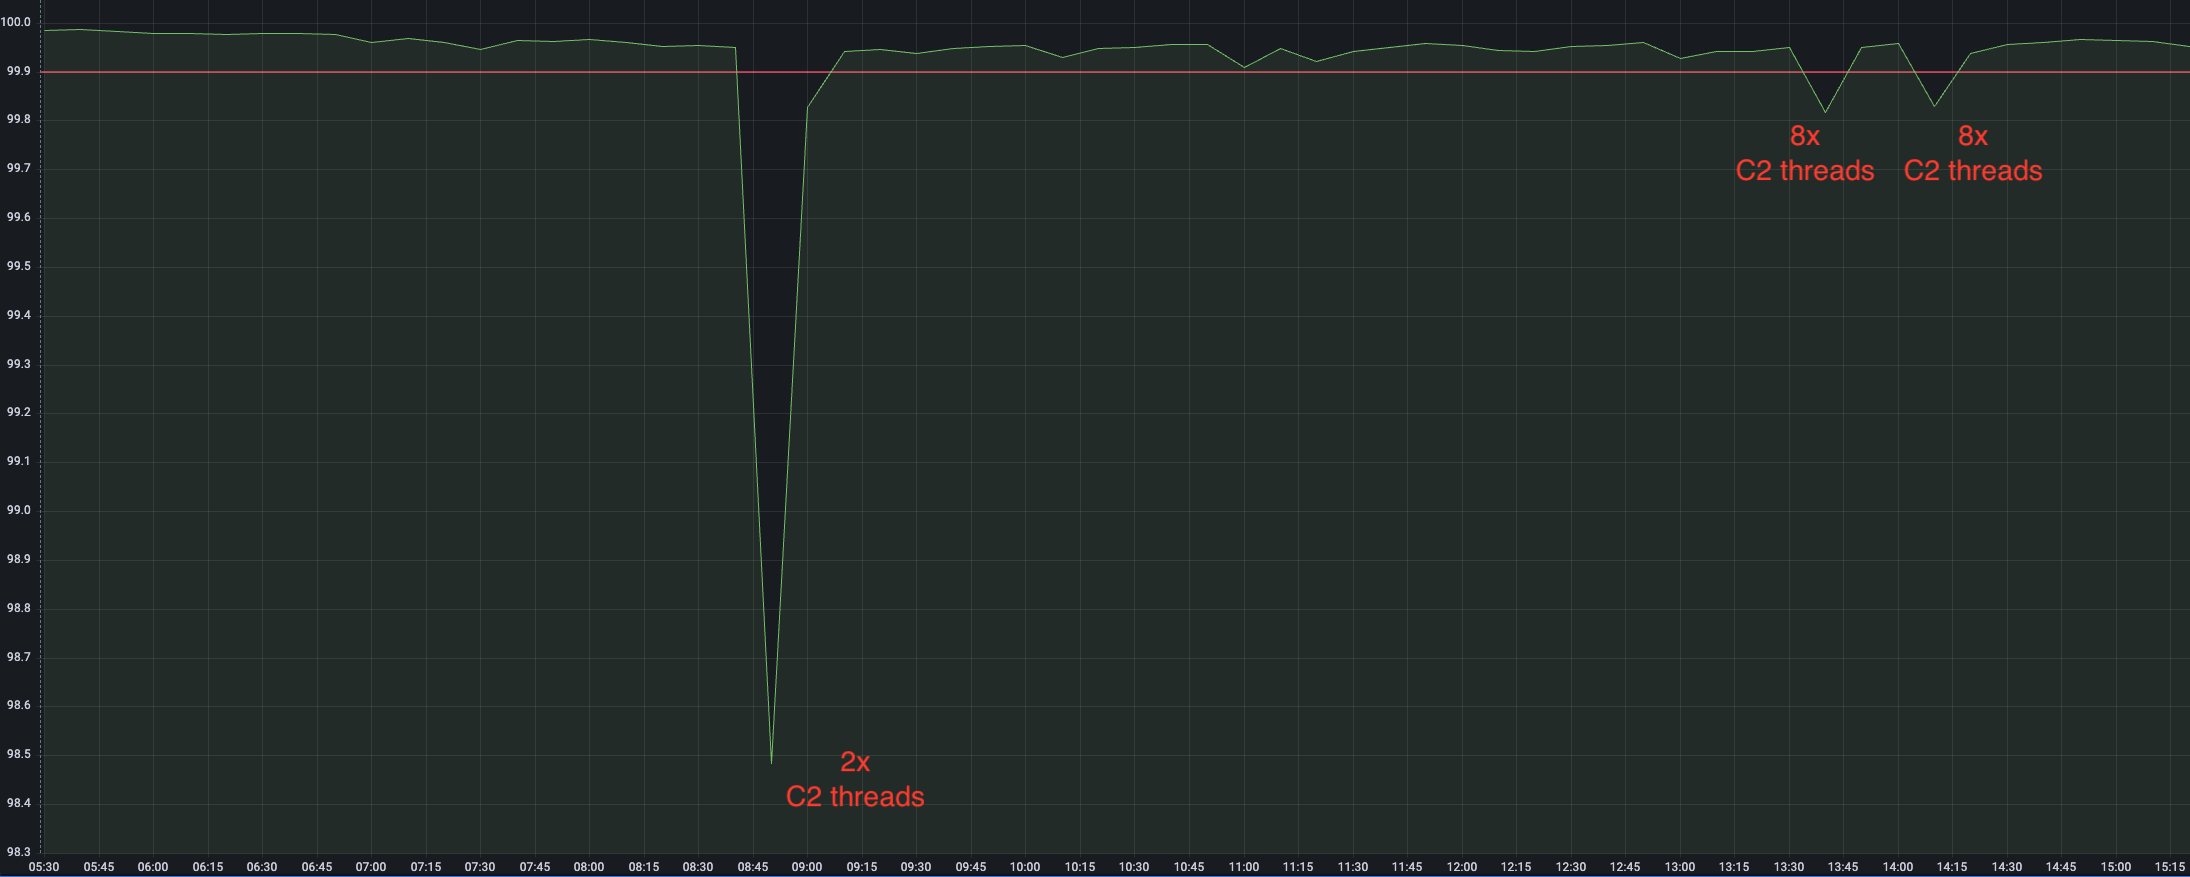
With more studies, we found that the major part of initial C2 recompilation takes around 30 seconds on default setup. During that time the app does not meet the SLA. With 8 threads recompilation is much faster, and now we need around 10 seconds. Nice progress, but it’s rather a theory verification and quick fix, not the solution yet.
The solution #
Our target is to make sure users are served on time. We can boost recompilation, but it doesn’t change the fact that there is a short time window when requests won’t be served. What we need is to allow user requests only when the hottest part of the code are recompiled. The question is, if we won’t allow traffic, how to trigger recompilation? Here you can leverage on Spring health mechanism combined with k8s startup probes.
class WarmUpHealthIndicator(private val warmer: Warmer) : AbstractHealthIndicator() {

    override fun doHealthCheck(builder: Health.Builder) {
        val result = warmer.warmUpIfNeeded();
        if (warmer.isWarmedUp()) {
            builder.up()
        } else {
            builder.down()
        }

        builder.withDetail("total", result.total)
            .withDetail("success", result.success)
            .withDetail("failure", result.failure)
    }
}
K8s will test startup probe, once the warmup is complete it will open up the app on user traffic. What’s left is to produce a bunch of requests in Warmer and voila.
private fun warmUp() = try {
        log.info("Warm-up started")
        val stopwatch = Stopwatch.createStarted()
        callAllTasks(IntRange(1, warmUpProperties.numberOfRequests).map { _ -> callOnEndpoint() }.toList())
        val elapsed = stopwatch.stop().elapsed()
        warmedUp = true
        log.info(
            "Warm-up completed, took: {} ms, total: {}, success: {}, failure: {}",
            elapsed.toMillis(), total.get(), success.get(), failure.get()
        )
    } finally {
        result.set(Result(total = total.get(), success = success.get(), failure = failure.get()))
        executorService.shutdown()
    }
Results #
We send a few hundred requests, the code heavily recompiles, to make sure it’s fast we slightly increased default C2 number from 2 to 4 threads (we didn’t keep 8 threads as in previous chapter tests - it doesn’t make much sense with warmup). Whenever we are done, we switch the flag and with next k8s check on startup probe, the application will finally allow user traffic, and requests now can be served as expected. Of course C2 recompilation will continue, and with time more and more code will get recompiled, but now it’s just a side process, not sth that freezes the application.
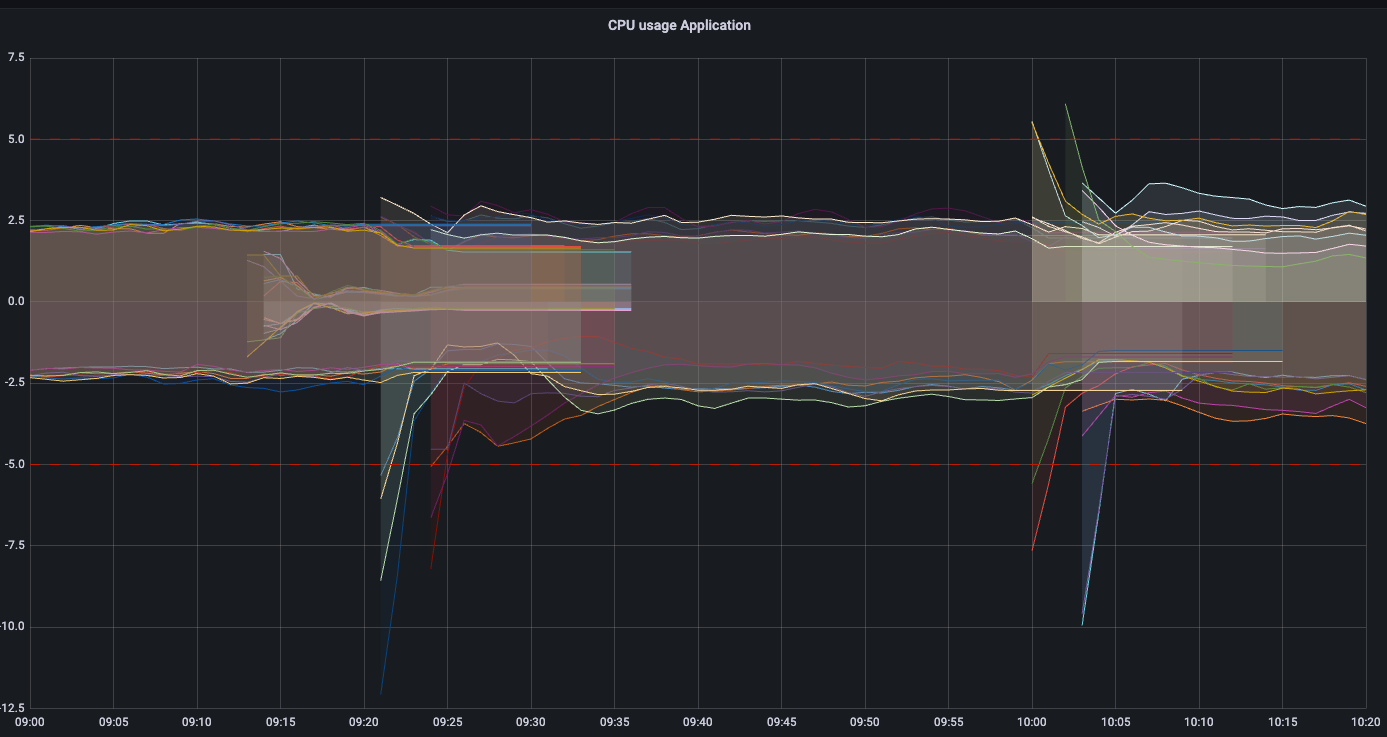
Let’s take a look at dashboards, CPU now looks as expected, spikes no longer take 20 / 50 cores.
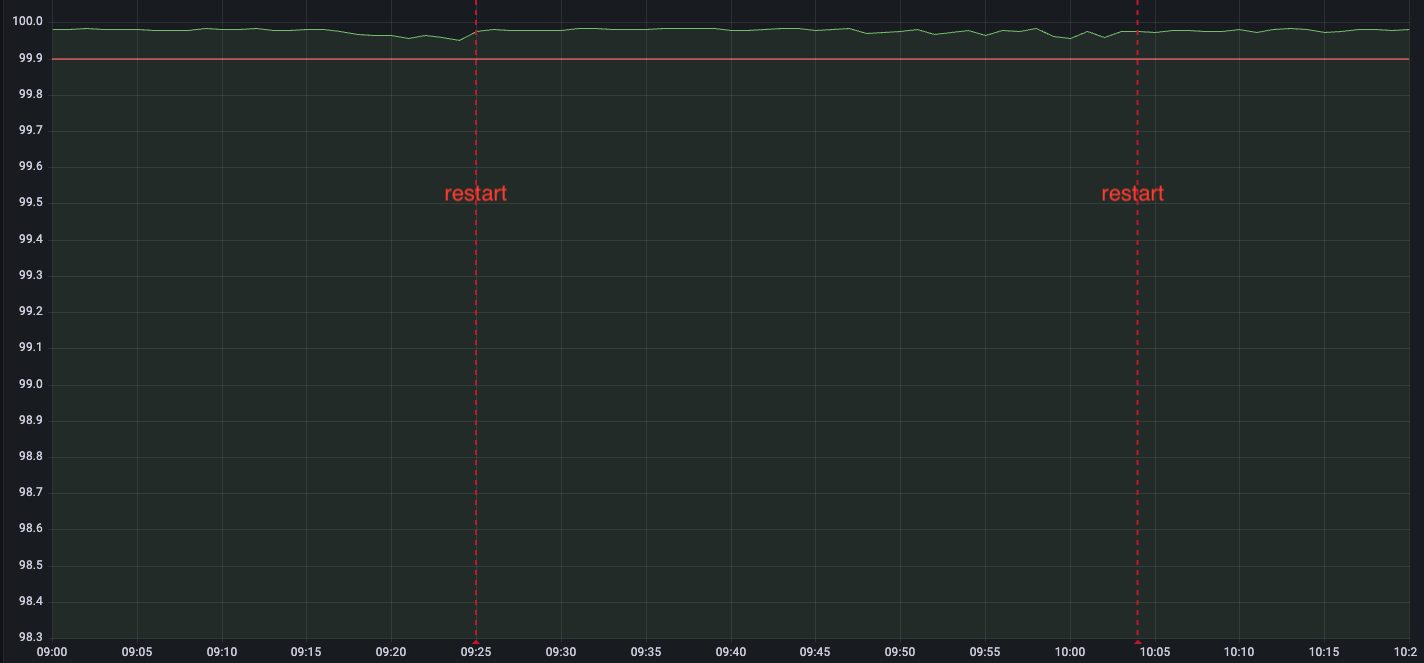
 But finally our SLA is healthy, restarts are completely transparent!
Final thoughts #
Since the beginning we knew that our application needed some kind of warmup, but we weren’t clear about the reason for that. Since it has a few external dependencies, we expected it to be more related to HTTP clients, connection establishing, filling caches etc. For sure it’s part of the process, but what we found about JIT surprised us. Introducing warmup and tuning JIT introduced great benefit, as finally any restart of a new version is completely transparent to our users. If you have a service which has a slow start I recommend you to check how much CPU it burns, if you see spike make a flamegraph or thread dump.