GC, hands off my data!
Certainly one of the main distinguishing features of the Java world is the Garbage Collector. Using it is safe and convenient, it allows us to forget about many tedious responsibilities, letting us focus on the pure joy of coding. Yet sometimes it can cause a headache too, especially when we notice that GC uses our resources too intensively. Each of us has probably experienced a time in our career when we wanted to get rid of the Garbage Collector from our application because it was running too long, too often, and perhaps even led to temporary system freezes.
What if we could still benefit from the GC, but in special cases, also be able to store data beyond its control? We could still take advantage of its convenience and, at the same time, be able to easily get rid of long GC pauses.
It turns out that it is possible. In this article, we will look at whether and when it is worth storing data beyond the reach of the Garbage Collector’s greedy hands.
Comfort comes at a price #
At Allegro we are very keen on metrics. We measure anything that can tell us something about the condition of our services. Apart from the most obvious metrics directly related to the application, such as throughput, the number of errors, CPU and memory usage, we also pay a great deal of attention to metrics related to the garbage collecting — GC working time and number of its cycles. Too much time spent on releasing the memory or too frequent GC launches may signal problems with memory leaks or indicate that it is worth considering optimising memory usage or switching to a different GC strategy.
Following the example of large technology companies, we have been organising company meetups within the so-called guilds for some time now. In one of such guilds, over a hundred engineers meet regularly once a month and discuss various topics related to performance, scaling and service optimisation. At one of these meetings, our colleague discussed the method of determining the actual size of data stored in a cache. Apparently, this is not a simple matter, as internal mechanisms for optimising memory usage, such as deduplication or compression, must be taken into account. After the presentation, an interesting discussion ensued about how much memory on the heap is actually used by the cache and how long it takes to clean it up. Someone pointed out that there is a hidden cost of using the cache that takes the form of time needed to free the memory of expired cache items, which not everyone is aware of. What is more, the manner in which the cache works does not quite fit the generational hypothesis and may mislead the JVM by preventing it from properly tuning the GC mechanism. I then began to wonder whether it might not be worth keeping the cache in an area excluded from the GC’s control? I knew this is possible, although I had never seen a practical implementation of this technique. This topic was bothering me for some time, so I decided to investigate.
Memory architecture #
Any skilled Java programmer knows the division of memory into young and old generation areas. People interested in details are probably also familiar with the more precise division into eden, survivor, tenured and perm. There are many excellent articles discussing this topic (like this one), so we won’t go into details. Instead, we will focus on a very specialised area of memory that the GC has no control over, which is the off-heap memory, sometimes also called native memory. This is a special area under the direct control of the operating system, which the JVM uses for its own purposes. It stores information about classes and methods, internal thread data and cached code necessary for operation. As I mentioned earlier, off-heap memory is not subject to the GC. In particular, it is excluded from garbage collection processes, which means that programmers creating the JVM code using this area are wholly responsible for freeing memory allocated for variables. There is also a dedicated area to which we — the programmers — have access as well. There is a possibility to write and read data from this space, remembering of course, that the responsibility for cleaning up after unnecessary variables lies entirely with us.
This area can be accessed using a simple API. The following code allocates 100 bytes of off-heap memory and stores a String and an Integer. At the end the data are loaded from the off-heap memory and then printed out.
int size = 100;

ByteBuffer buff = ByteBuffer.allocateDirect(size);
buff.put("Michal".getBytes());
buff.putInt(42);

buff.position(0); // set the pointer back to the beginning

byte[] name = new byte[6]; // length of my name
buff.get(name);

out.println(new String(name));
out.println(buff.getInt());
Note the allocateDirect method that allocates off-heap memory unlike a similar method: allocate that allocates
on-heap memory. The behavior of both methods can be compared with the help of a profiler
(I will use jConsole). The following programs allocate 1GB of memory,
respectively, on-heap and off-heap:
ByteBuffer.allocate(1000000000)
ByteBuffer.allocateDirect(1000000000)
The chart below shows heap memory profile comparison for both programs (on-heap on the left vs. off-heap on the right):

Such a possibility to bypass Garbage Collector may seem extremely tempting to developers struggling with long working time of the GC. However, this raises the question: what type of usage justifies the extra effort involved in manually freeing the memory and the potential risk of error? What are the advantages of using off-heap memory? Is it faster? How much time will we save by bypassing the GC? Why is this method so uncommon? To put it simply: is it worth doing and if so, when?
Be gone GC! #
GC is a wonderful tool. It allows us – although sometimes only for a while – to forget about the problems related to painful memory management. We can create variables of any type and any scope almost freely, and not worry about what happens to memory once we stop using them. This task is handled by the GC, which does it brilliantly. In each successive version of the JDK we get a new algorithm, which in some specific cases is even better than the previous one.
However, I’m more than sure that many of us have once encountered the problem of long GC time or too frequent GC calls. Every developer has their own ideas on how to deal with this issue - we look for memory leaks, profile the application in search of hot spots, examine the scope of created variables, use object pools, verify the system behaviour with different GC algorithms, and check the cache configuration.
In my case, it is the cache that is often responsible for long GC time. Sometimes it stores large numbers of objects, usually complex ones, containing references to other objects. What is more, the way cache objects are accessed is often not uniform. Some objects are never queried after being inserted into the cache, others are read throughout their whole lifecycle. This causes the cache to disrupt the somewhat ideal world order defined by the generational hypothesis. Then, GC algorithms are faced with a very difficult task of determining the optimal way to clean up the memory freed by the items removed from the cache. All this causes the cache cleanup to be expensive. This made me wonder if there was any benefit in storing cache data outside the heap?
Off-heap space: Pros and cons #
In a sense, the off-heap space lies outside the control of the JVM (though it belongs to the Java process), and for this reason, it is not possible to write complex structures used in JVM languages into it. This raises the need for an intermediate step of serializing the data into a plain byte array, which can then be stored in the off-heap area. When the data is loaded, the reverse process must be performed: deserialization into a form that we can use in Java. These additional steps will of course come at an extra cost, which is why accessing off-heap data will, for obvious reasons, take longer than accessing on-heap data directly.
Since writing and reading data in the off-heap space takes longer, what is the benefit of this approach then? Well, the data stored in the off-heap space are not subject to GC processes, so on the one hand we – the programmers – are responsible for each freeing of memory after a given variable is no longer useful. On the other hand, we relieve the management processes in the JVM by releasing CPU’s time for the rest of the application, so, theoretically, it should result in some resource savings. The question is, do these differences balance each other out to any degree? Will the savings associated with the GC process balance out our longer data access time? If so, does it depend only on the amount of data, or is there a specific usage scenario? To answer these questions, it is necessary to run a few experiments.
Experiments #
We can store any data structure in the on-heap area, which means that the advantage of this approach lies in the fact that there is no overhead involved in transforming the data to another form, while its disadvantage consists of the additional cost related to the GC. On the other hand, in the case of off-heap storage, there is no GC extra cost, but there is the cost of serialising the data to a byte array.
Over the last years, significant progress has been made in the field of GC and with the right matching of the algorithm to the application profile, its time can be very short. But is there any case where it is worth reaching into the unmanaged space after all?
I decided to start with an overview of what open-source options are currently available. When it comes to the implementation of the on-heap cache mechanism, the options are numerous – there is well known: guava, ehcache, caffeine and many other solutions. However, when I began researching cache mechanisms offering the possibility of storing data outside GC control, I found out that there are very few solutions left. Out of the popular ones, only Terracotta is supported. It seems that this is a very niche solution and we do not have many options to choose from. In terms of less-known projects, I came across Chronicle-Map, MapDB and OHC. I chose the last one because it was created as part of the Cassandra project, which I had some experience with and was curious about how this component worked:
OHC was developed in 2014/15 for Apache Cassandra 2.2 and 3.0 to be used as the new row-cache backend.
To run the experiment, I decided to use a service built to provide the offer description based on its unique number. After downloading the offer description from the repository, it is placed in the cache to speed up future calls. Obviously, the cache has a limited capacity, which is chosen in such a way that it forces the deletion of items that have been placed in it for the longest time ago.
In our cache, the offer number is the key, while its description in the form of a string of characters is the value. This allows us to easily simulate almost any size of data in the cache (all we have to do is to make the offer description longer), and additionally, it makes the overhead related to the aforementioned serialisation relatively small – serialisation of a text string is obviously faster than a complex DTO object.
In my project, I used the Caffeine cache to store the data in the on-heap area and OHC library to store it in the off-heap area.
The test scenario consists of querying for descriptions of different offers. During the test, I will collect data on memory and GC parameters using jConsole. I will run the test scenario using jMeter, which additionally will allow me to measure response times.
From my preliminary research I know that this method is only applicable to memory-intensive systems. However, for the sake of order, let’s first run an experiment on a small cache size with element set to 5 KB:
- maximum number of cached elements: 10000
- cached element size: 5.000 bytes
- 10 threads querying for random offers in a loop of 100000 iterations each
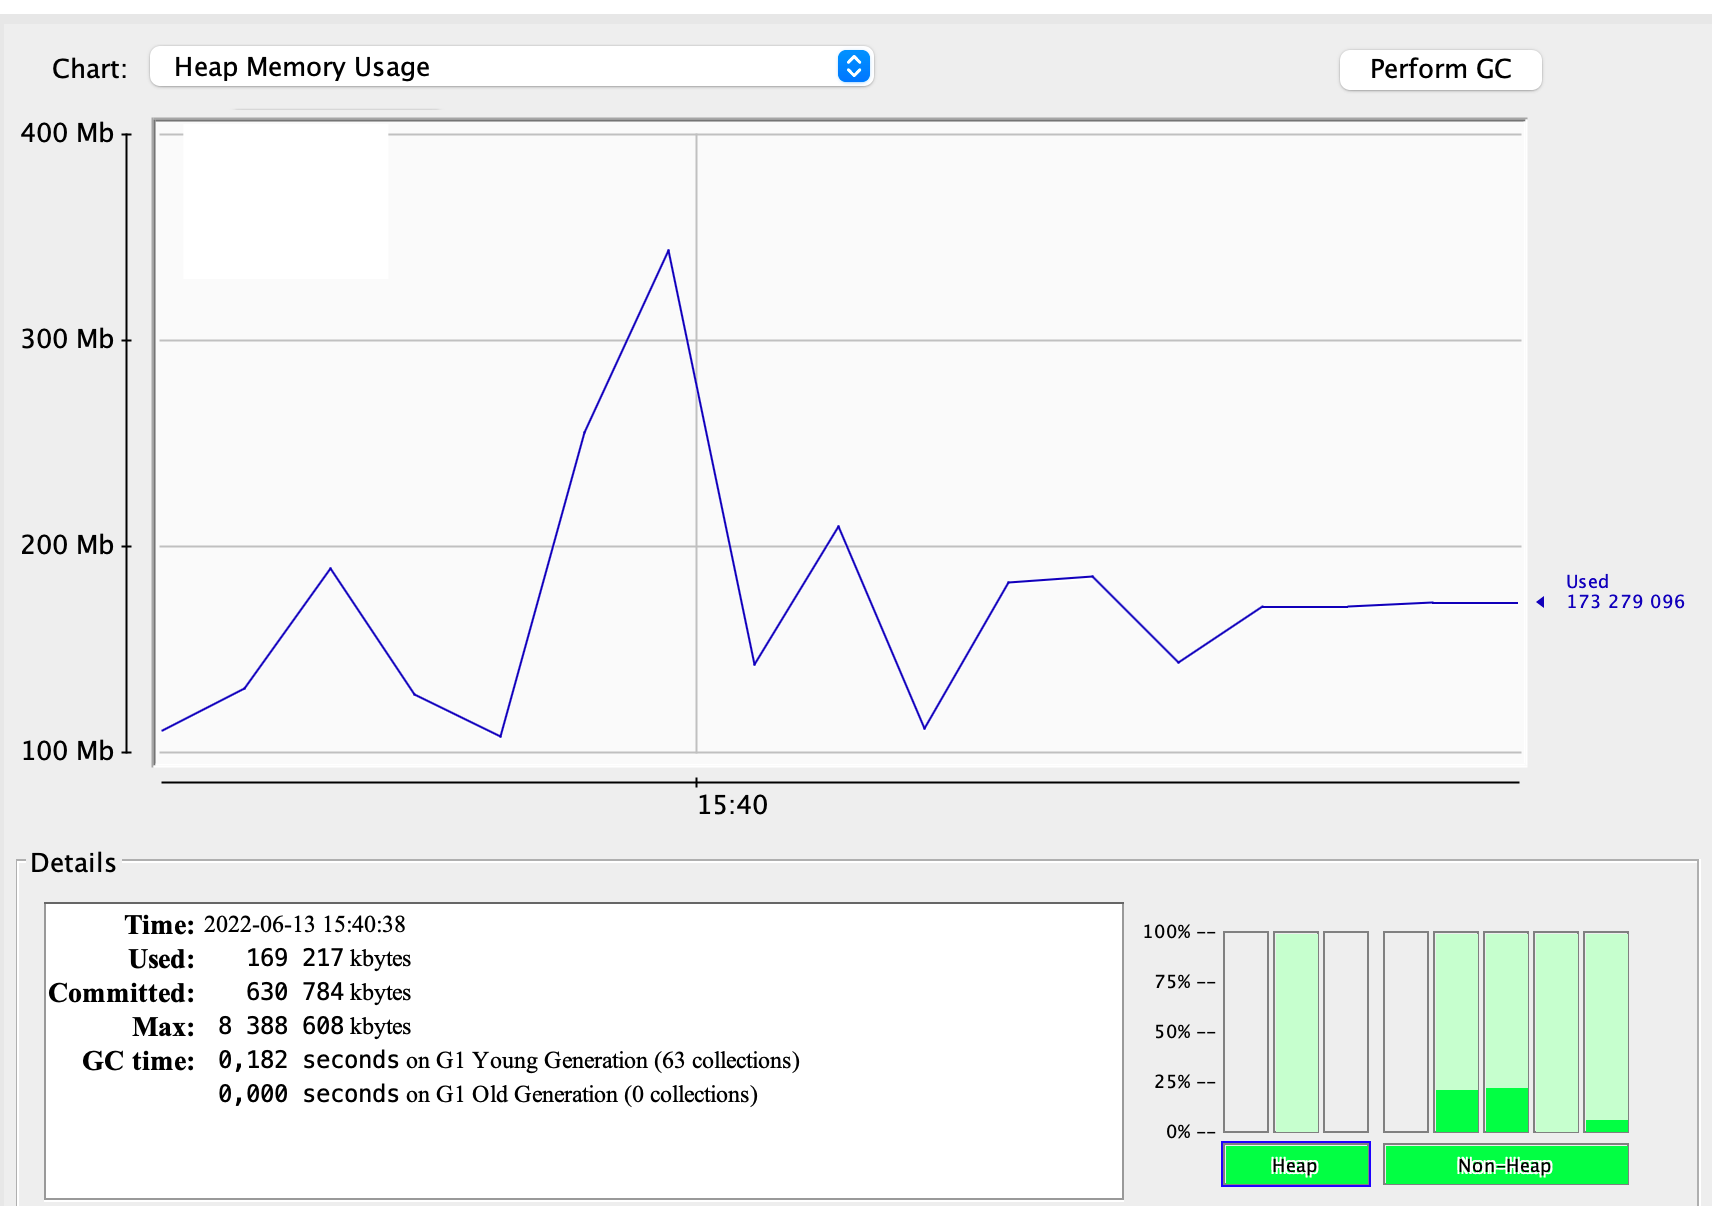
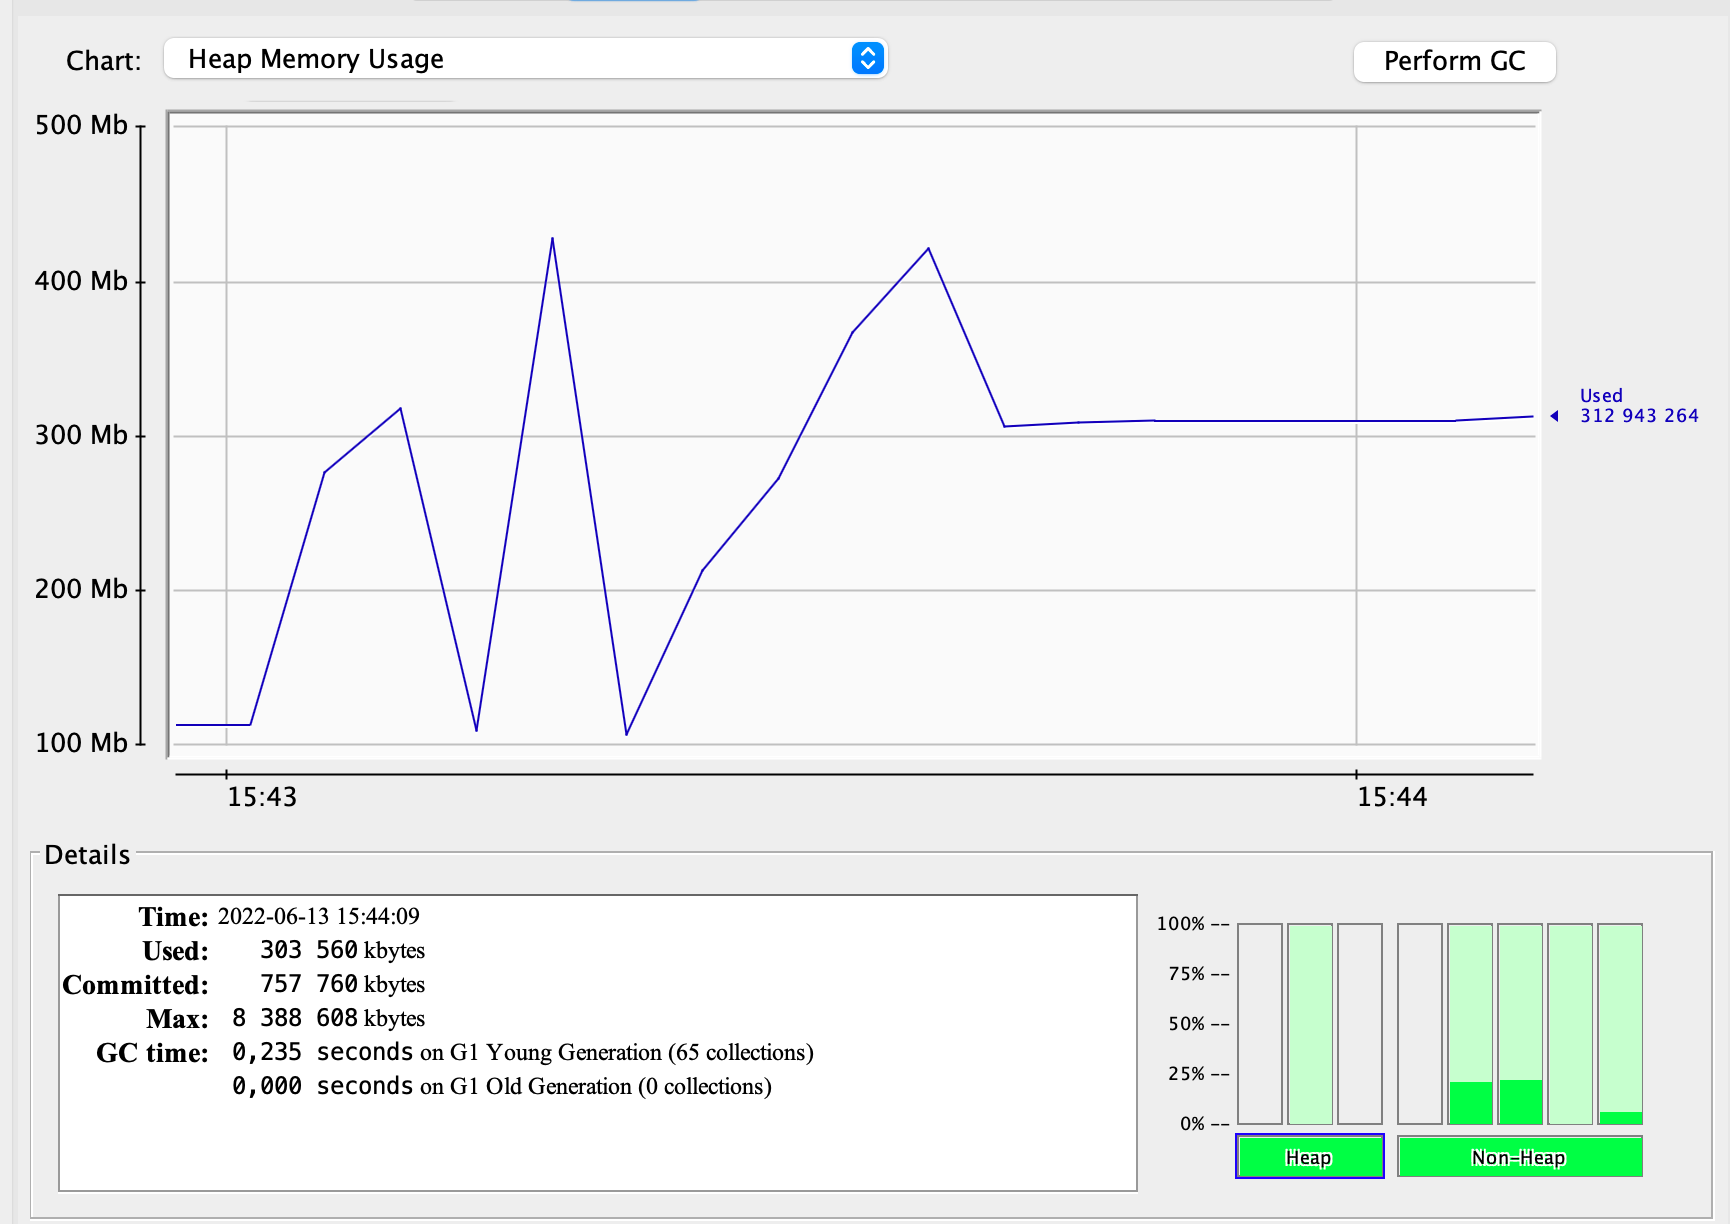
Take a look at the screenshots from jConsole below. The results are in line with expectations: no benefit from the use of off-heap space. Both the number of garbage collection cycles (63 vs. 65) and GC run time (0.182s vs 0.235s) are nearly identical in both cases:
The GC profile of on-heap variant:

The GC profile of off-heap variant:

Not much of an improvement for small to medium cache size. However, this result is not disappointing to me because I expected it. GC is designed to handle much more memory than 400 MB, it would therefore be strange if we obtained an improvement at such an early stage.
Now let’s see how the comparison looks for a much larger cache element size, let’s increase it up to 100 KB. At the same time, due to the fact that I am running the tests on a laptop with limited resources, I will reduce threads configuration and cache maximum element size.
The configuration of the second test is as follows:
- maximum number of cached elements: 5000
- cached element size: 100.000 bytes
- 10 threads querying for random offers in a loop of 1000 iterations each
Let’s take a look at the results.
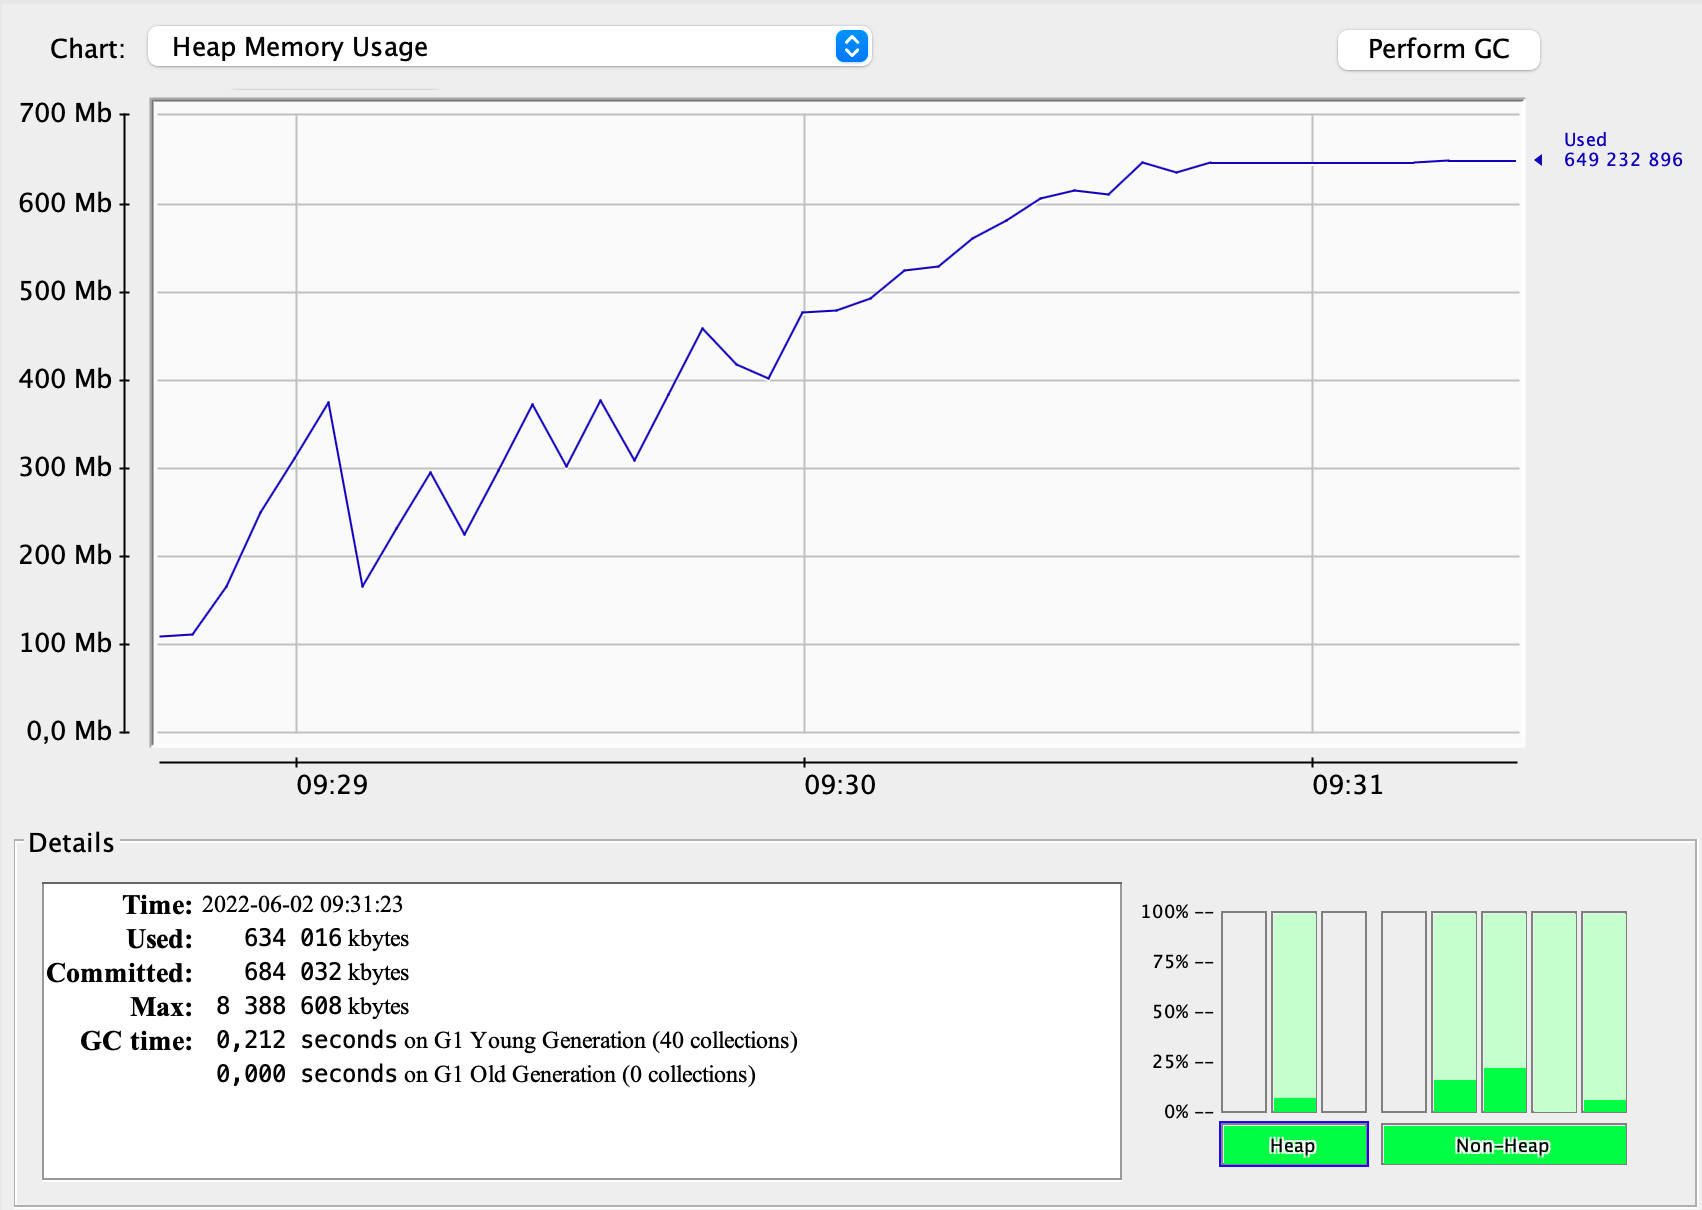
The GC profile of on-heap variant:
 Memory usage increases throughout the test, there are 40 GC collection cycles that together last 0.212s.
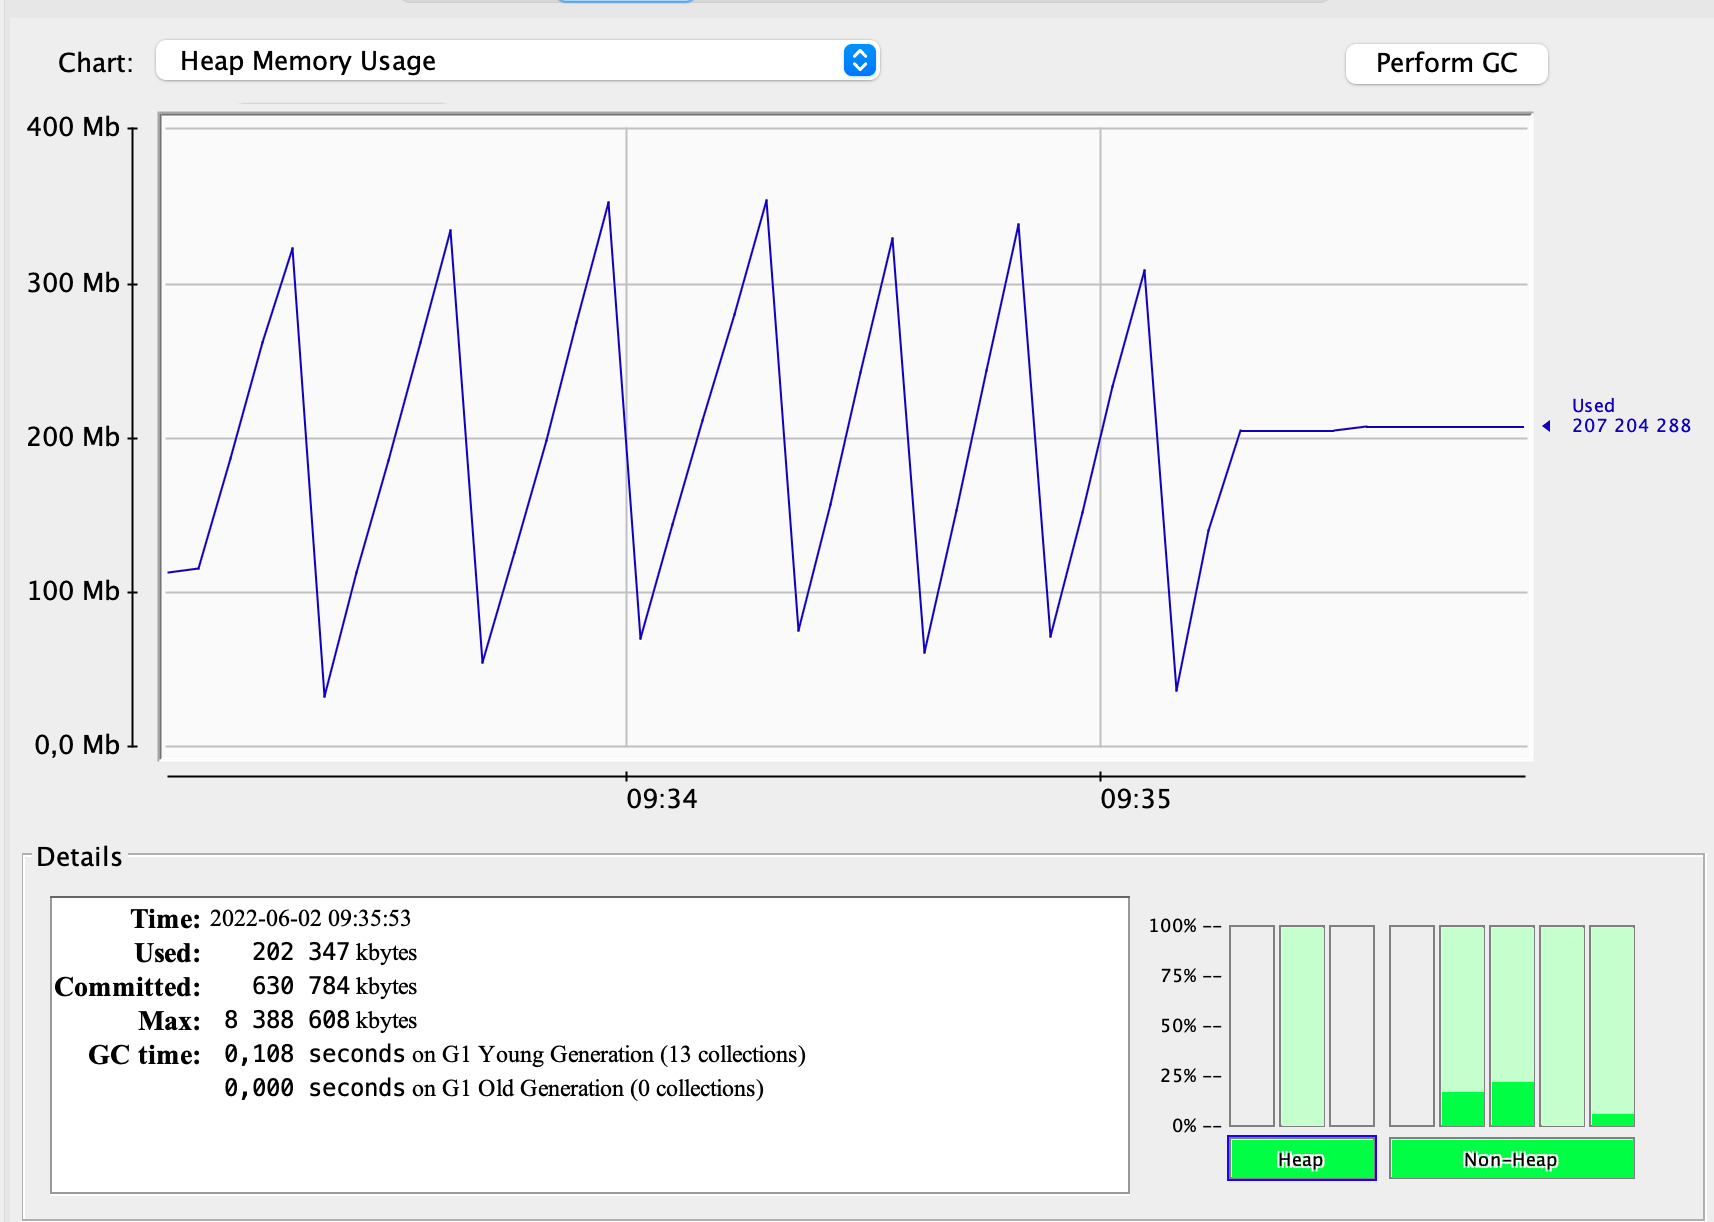
The GC profile of off-heap variant:
 This time heap memory usage chart definitely looks different, is shaped like a saw, and reaches half of the previous value.
Please note also, that this time there are only 13 GC cycles with total time of 0.108s.
The results of the GC profile comparison are therefore as expected, and what about the response times?
jMeter metrics of on-heap variant:

jMeter metrics of off-heap variant:

Request time metrics data is also in line with predictions, off-heap variant proved to be slightly slower than on-heap.
Now let’s see what effect increasing the data size will have on the results. Let’s do tests for the following sizes: 100.000 B, 200.000 B and 300.000 B, jMeter configuration stays unchanged: 10 threads with 1000 iterations each. This time, for the sake of clarity, the results are summarized in a table:
| Cached item size | Variant | GC cycles count | GC time | Request time (median) | Throughput |
|---|---|---|---|---|---|
| 100.000 B | on-heap | 40 | 0.212 s | 171 ms | 83.2 rps |
| 100.000 B | off-heap | 13 | 0.108 s | 179 ms | 78.1 rps |
| 200.000 B | on-heap | 84 | 0.453 s | 396 ms | 38.2 rps |
| 200.000 B | off-heap | 19 | 0.182 s | 355 ms | 40.2 rps |
| 300.000 B | on-heap | 114 | 0.6s | 543 ms | 27.3 rps |
| 300.000 B | off-heap | 27 | 0.185s | 528 ms | 27.9 rps |
It turns out that as the size of cache item increases, the benefits of using off-heap space grow – all metrics are improved.
What about cache maximum elements? Let’s use 200.000B item size and check what happens when we increase the maximum cache element size, we will test cache for 5000, 10.000 and 15.000 elements:
| Cache max elements | Variant | GC cycles count | GC time | Request time (median) | Throughput |
|---|---|---|---|---|---|
| 5000 | on-heap | 84 | 0.453 s | 396 ms | 38.2 rps |
| 5000 | off-heap | 19 | 0.182 s | 355 ms | 40.2 rps |
| 10000 | on-heap | 81 | 0.46 s | 393 ms | 38.8 rps |
| 10000 | off-heap | 19 | 0.173 s | 345 ms | 42.6 rps |
| 15000 | on-heap | 84 | 0.462 s | 355 ms | 41.8 rps |
| 15000 | off-heap | 19 | 0.167 s | 344 ms | 42.6 rps |
No surprise here either, increasing cache size has a positive impact on both variants. Of course in case of on-heap cache, some of the benefits are offset by the need for cleaning larger memory area.
With the experiments conducted, we can conclude that the more data we store in memory, the greater the benefit of using the off-heap area may be. At the same time, it should be added that these benefits are not huge, just a few RPS more. In the case of systems that store tremendous amounts of data, this method may bring some improvements in terms of resource utilization. However, for most of our apps and services, that’s probably not the way to go, a code audit is a better idea.
This is probably a good time to highlight how well implemented the current memory sweeper algorithms are. Well done GC!
Conclusions #
Everyone has probably come across a case when an application froze as a result of GC’s operation. As the above data show, there is a relationship between the amount of data stored in memory and the time the GC requires to clean it up – the more data we store on the heap, the longer it takes to free the memory. That is why the cases where we process large amounts of data provide us with a potential benefit of using the off-heap area. There are some very specialised uses of this technique, such as Spark, which can store large amounts of data for subsequent processing steps and can do so using the off-heap space (you can read more about Spark memory model here). Another example of the use of the off-heap approach is the Apache Cassandra database. The OHC used in this post was developed from this particular project.
There is a very narrow group of cases where storing data outside of GC control is justifiable. However, for the vast majority of applications, a much better approach is to take advantage of ever-improving GC implementations. If you have experienced problems with the slow performance of the GC while developing your business service, you should definitely audit your code first and experiment with different heap size settings and the GC algorithm. When all other methods fail, you can give the off-heap area a try.
However, if you are working on a server that processes massive amounts of data, it is worth considering off-heap storage earlier, similar to Spark or Cassandra solutions.
