

OAuth rate-limiting
Every e-commerce platform needs some kind of central authorization system. At Allegro we use OAuth and have our own implementation that stays true to the RFC. Allegro has millions of users. There are also a lot of requests that go through OAuth services. At some point there comes a need to have better control over how much traffic we want to allow in a certain time window, while maintaining full performance of the platform. Here is where the idea of rate-limiting comes in handy.
Prologue #
According to OAuth RFC, to use OAuth you need to be a registered client. Some clients are very small external integrators (simple shops), while others are in a different league and can produce millions of requests per day (Allegro mobile and other large partner apps). Every user can create their own OAuth client and use it to integrate with Developers API. Unfortunately, not all of them do that correctly as per RFC.
Normally such clients are not a big issue, but in certain cases they can generate a lot of unwanted and unneeded traffic. This traffic includes, but is not limited to, creating huge numbers of new access tokens that are then thrown away instead of being reused.
According to the RFC, the access tokens generated with most grant types (e.g. authorization code grant) should be reused up until their expiration period. When they expire, the provided refresh token should be used to receive a new access token via refresh token grant.
Some of the clients rarely refresh tokens or even don’t reuse them at all. This causes a lot of unnecessary traffic (often in the form of sudden spikes) that can lead to potential issues on both sides. We had pretty good monitoring of this issue, but we needed better tools to deal with that problem as well as to educate the clients to make proper use of OAuth.
Planning the solution #
Before tackling the problem directly we needed a little more information and careful planning. Firstly, we wanted to make sure that our solution would solve the problem. Secondly, blocking too many clients could end up in disaster. To be certain that our solution was error-free, we started by making sure that we knew what we want to achieve. Here are the properties we expected from our solution:
- It cannot block trusted clients such as Allegro apps.
- It should not negatively affect performance.
- It should be configurable per client since different clients have different traffic characteristics.
- It should be able to distinguish between user and non-user use of OAuth. Client credentials grant used without context of a user, for example should be treated differently than user-based authorization code grant. In effect, the limiting “per user” should be introduced in the second case.
- It should directly cause an improvement in traffic spikes.
- It should work well in a highly distributed environment with dozens of service instances and database nodes.
- It cannot be too costly or require too much additional infrastructure like additional databases, external systems, etc.
Tackling the problem #
To meet those needs we needed a robust solution. Since RFC leaves a lot of room for implementation by end-users, it does not specify how such rate-limiting should work.
As with every problem of such kind, it’s worth starting with in-depth research of existing solutions. There are various strategies and approaches to this problem in many different scenarios, but only a few of them were applicable to our case and enabled us to fulfill our goals.
As usual, we also explored the existing implementations of such solutions in the form of enterprise or open-source libraries and frameworks. Unfortunately, we did not find any that would meet all of our needs and at the same time be flexible enough to easily integrate into our ecosystem. It’s also worth noting that we were limited by certain constraints such as long-term costs of additional resources.
In the end, we decided to go with implementing our own solution. There were several algorithms to choose from that could serve as its base:
- Precise query-based per-user counter — query the database for a token count for each request. Not suitable, because it would cause way too much database traffic.
- Fixed window based on TTL documents — uses a rate-limit counter that is cleared every fixed period. While less challenging for the database, it shares a common vulnerability with the first algorithm: sudden TTL-caused spikes in allowed requests that consequently cause all of the following requests to be blocked (rate-limit exhaustion).
- Sliding window log — stores all requests as a timestamped log entry in a database, that are later aggregated when needed. Too costly, because again it would cause too heavy a load on the database.
- Sliding window — uses a rate-limit counter that is a time-based weighted moving window. It has the advantage of relatively low database load of the fixed window algorithm without its spike-related flaws.
We carefully weighed the pros and cons of each of those options and finally decided to make a PoC of the fourth option: the sliding window algorithm.
The algorithm is based on counters that each hold a count of requests in their respective time frames. At each point of time, an abstract window is calculated from two neighboring frames: current and previous. The further away the window is from the previous frame, the more important the counter from the current frame is. The weight is based strictly on proportions. If, for example, the span of the current window is 75% of the previous frame and 25% of the current frame, then the value of the current rate-limit counter is a sum of 75% of the previous frame counter and 25% of the current frame counter. The results are put into a hashmap with users as keys and counters as values, which acts as a cache.
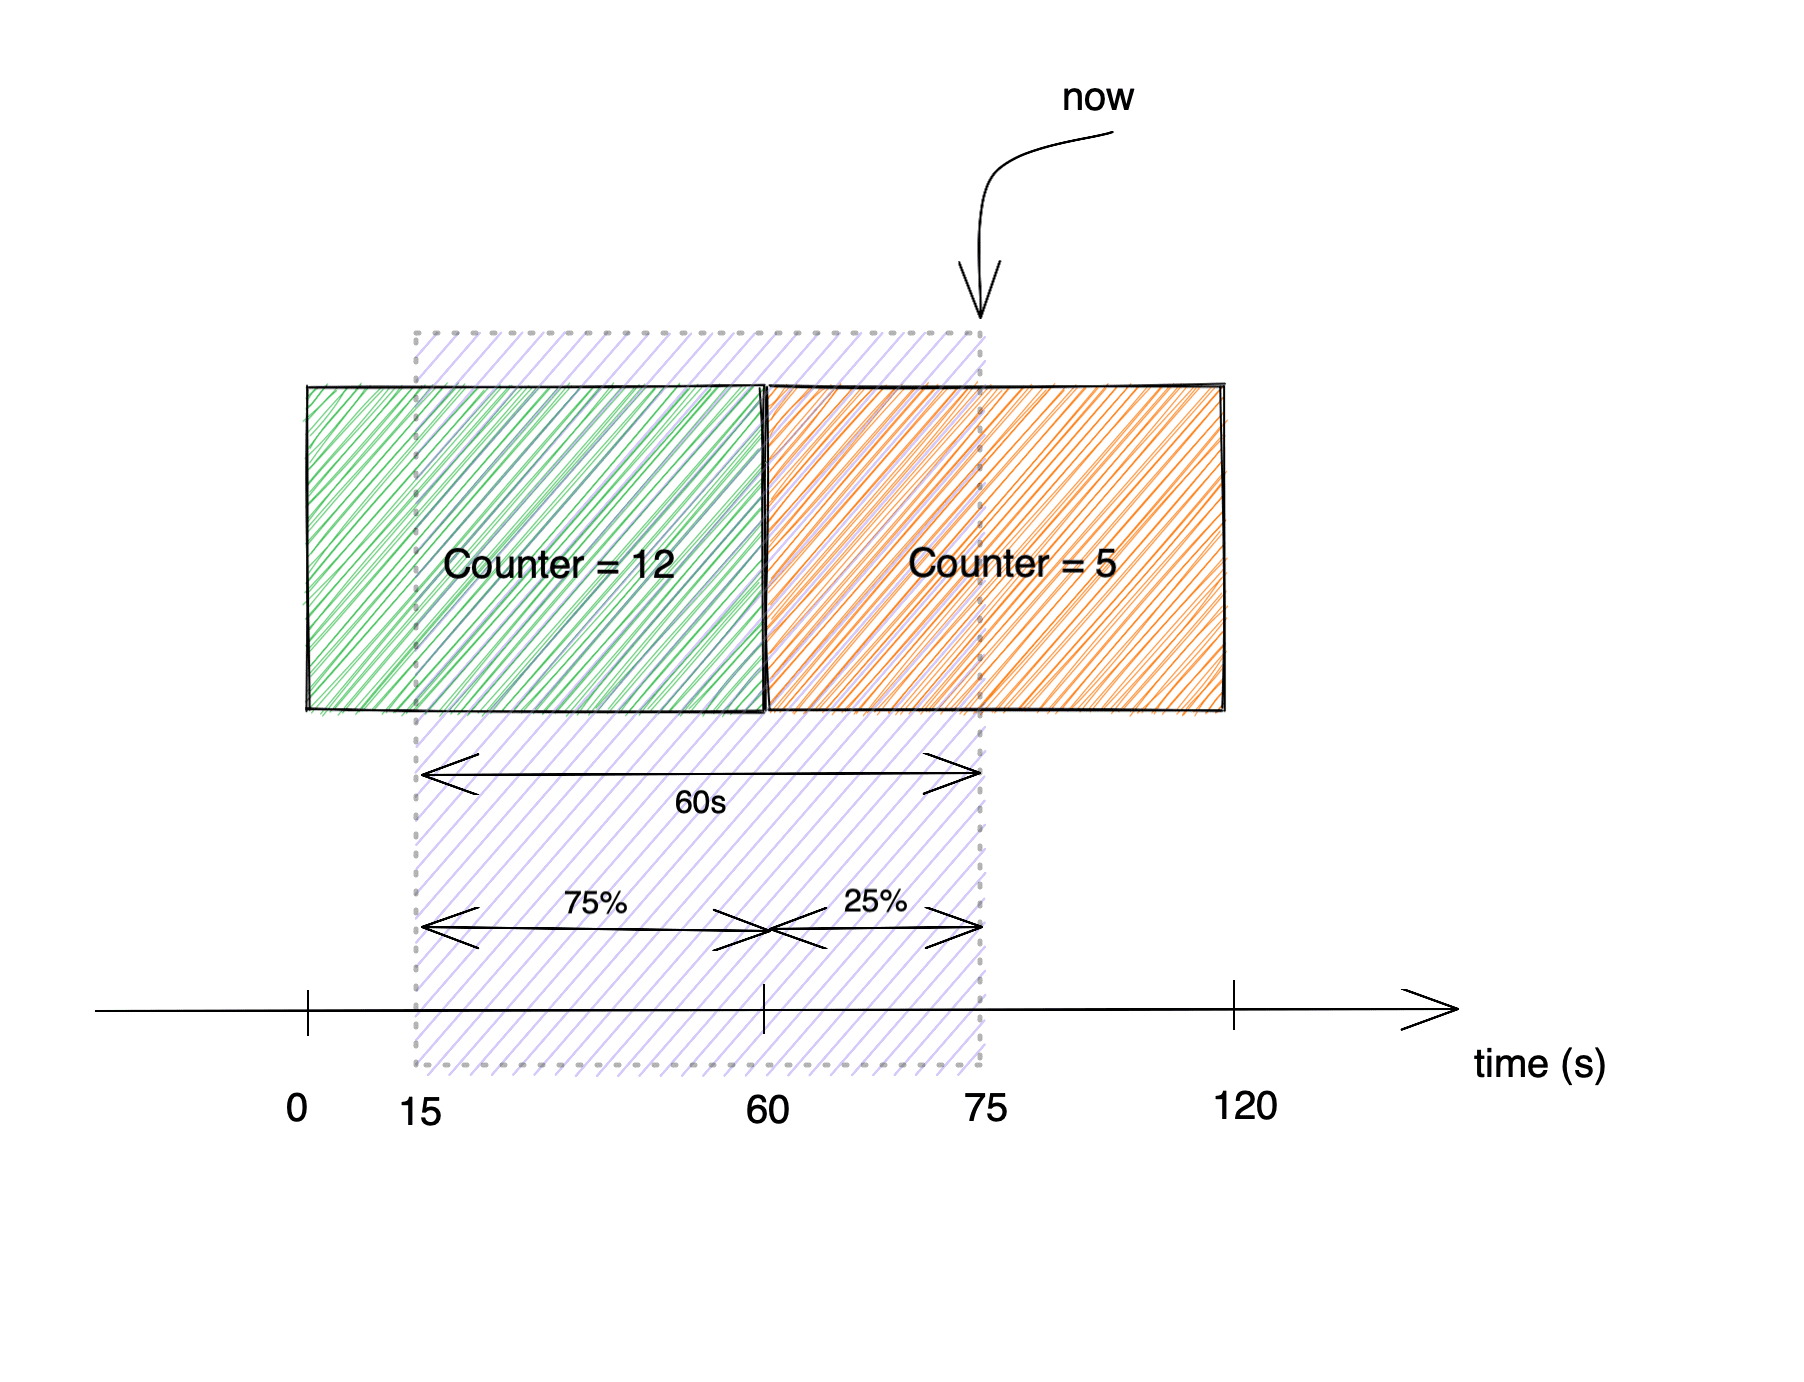 In the picture above the current counter value would be:
value = previousCounter * partOfPreviousFrame + currentCounter * partOfCurrentFrame
value = 12 * 0.75 + 5 * 0.25 = 10.25
The time complexity of the sliding window algorithm is O(1) since it’s a simple hashmap get operation, while its space complexity is O(n) where n is the number of user counters held by an instance. It works well in distributed systems because it’s based on simple counters that are relatively easy to synchronize. Its cost is low since we only need to store simple counters and can easily minimize database queries, as well as improve performance with caching in a straightforward manner. Thanks to the fact that the sliding window takes into account the time relative to the current timestamp, we can flatten the token creation spikes. Its main disadvantage is that it indirectly relies on the even distribution of requests in time, which makes it less sensitive to spike traffic within one time window.
Following the plan #
Remote state synchronization #
There are two kinds of states that need to be tracked for the rate-limiting to work. The first one is the global state. It’s basically a global counter of all requests made by a client to rate-limited OAuth endpoints within a certain period. This state is persisted in the database and from its perspective represents the most recent rate-limit status.
The second type is the local state of each instance, one part of which is the local counter of incoming requests for a client within a time window. Since instances are not directly connected to the client and every one of them can make requests to different instances concurrently, the local counter of each instance for that client will most probably have a different value. Rate-limiting is a global functionality in the sense that we are interested in the value of global counters and not of individual counters. Consider the following scenario: we would like to set a rate limit of 50 RPS for a client while having 10 instances. If we relied only on local counters to do the rate-limiting, it would be possible for the traffic of 500 RPS to be split evenly between instances and not trigger rate-limiting - and that’s not the result we are aiming for.
To decide whether to reject an incoming request or not, the local instance needs a second part of the state - a global counter. When making a decision, it sums both the local and the global ones to check whether new requests would go beyond the rate-limit boundaries.
Consequently, the instances need to be aware of the requests made to the others and for that to work, the global counter needs to be updated regularly. Each instance will periodically try to flush the sum of global and local counters from their state to the database. Here is where things get tricky. If several instances are trying to save different global counters, there is a risk that one of them will attempt to overwrite the changes that were just saved by the other. To counter that, we use a mechanism called optimistic locking that is described later in this post. Once the state is persisted successfully, the local state is cleared. At this point, it consists of the incoming requests counter that is equal to 0 and the global snapshot counter that is equal to the value persisted in the database for that client.
Caching clients’ global state #
Any instance should be aware of the rate limit state for the whole cluster. It represents the global number of requests made by a particular client and its users. We keep a mapping between a pair (client_id, username) and the number of requests made in memory, which makes our algorithm efficient. There is one caveat: keeping all the clients and their users would take too much space, so we only keep those clients and users who are actively making requests to the OAuth server. As soon as they stop calling our servers we delete them from the instance’s cache.
Sharing the state #
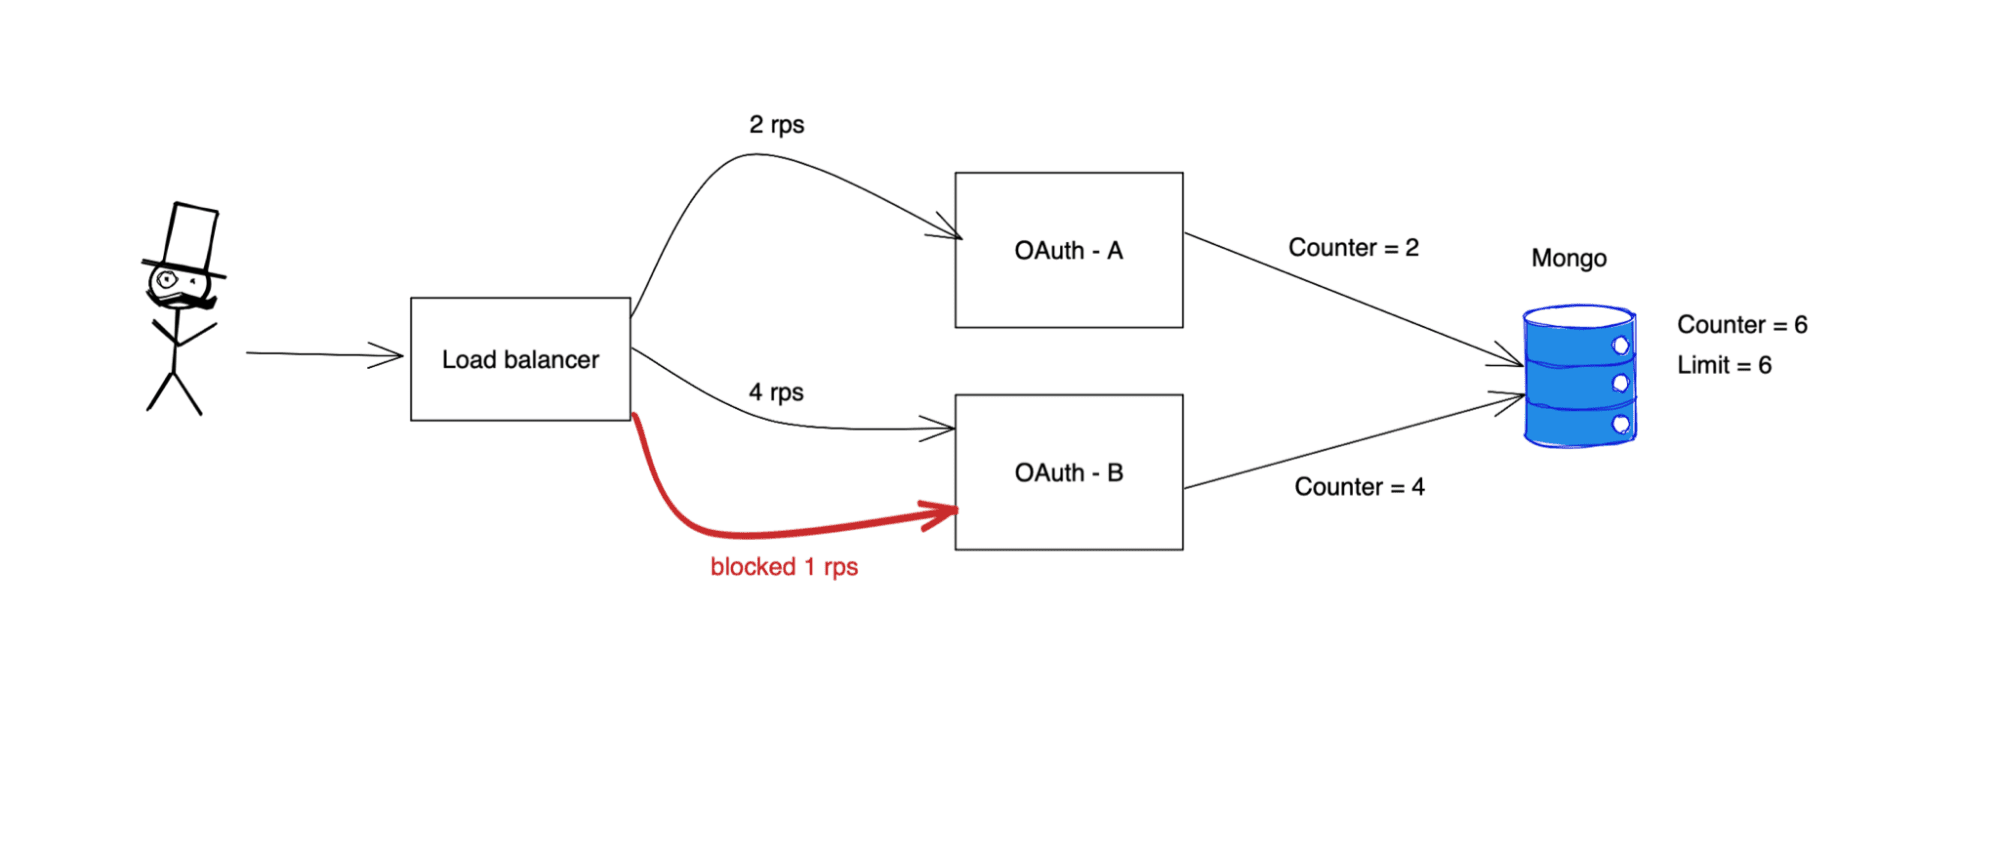
Our internal OAuth service works in a distributed manner. There are many instances of the OAuth servers and we should have mechanisms to coordinate rate-limiting between them. In practice, it means that if a client is making a request to server instance A, the server instance B should consider it when calculating the allowed number of requests in the current time window. Below are the key points that sum up this description:
- We have a global request counter per each client/user.
- The counter is stored in the Mongo database.
- Each instance shares the counter - it reads and writes its current value.
- The counter depicts the window in the current timestamp.
{
  "_id" : {
    "clientId" : "some-client",
    "username" : "some-user"
  },
  "version" : NumberLong(405),
  "expire" : ISODate("2021-05-29T14:24:01.376Z"),
  "requestCounters" : {
    "1622211780" : 1,
    "1622211840" : 1
  }
}
The counter consists of a few fields:
_id- to uniquely identify the client and the user connected with the request.version- for the optimistic locking purposes.expire- used to remove the counter if it has no updates, which means that the client is not currently creating new tokens.requestCounters- mapping of the number of requests at consecutive points in time.
The counter is cached so we don’t have to fetch it each time the request from the client is made, since it would kill performance. Each instance refreshes the counter asynchronously - reads and writes to the Mongo database are made in a dedicated thread. Each one also holds the counters only for the clients they have to handle. A particular instance removes the client’s state after it stops sending requests.
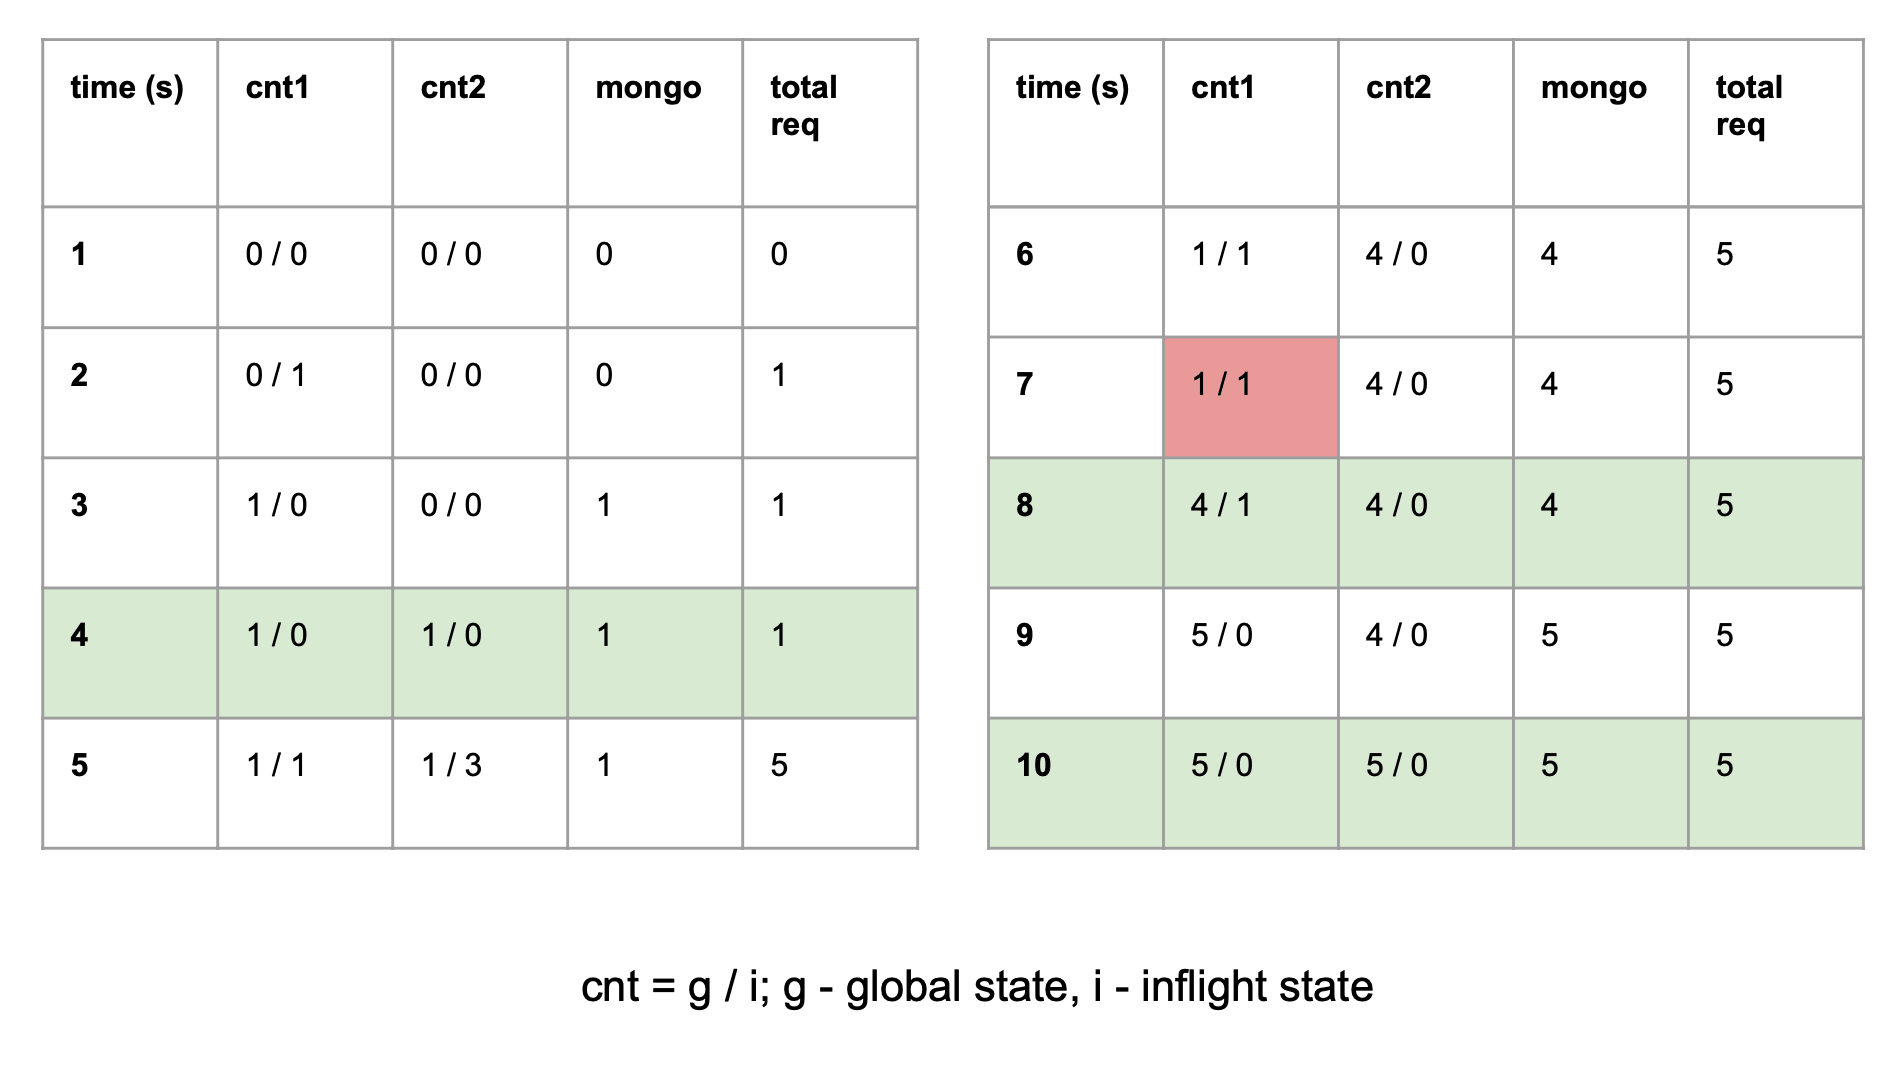
This table depicts an example flow of counters on two instances (A, B) of our OAuth service. Each of them has its own counter (accordingly cnt1 and cnt2), mng is a state in the sharded Mongo database and total req is the sum of all requests made to all instances.
The state of each instance consists of two counters (g / i). The first one (g for “global”) describes how many
requests have been globally made and are persisted in the database. The second one tracks how many requests have come to
that instance since the last flush (i for “in-flight”). The total number of requests from its perspective is the sum
of g and i and it is the value that is going to be persisted.
Below is the description of what happens in this scenario, step by step:
- There is an initial state with no requests made to either instance.
- One request is made to instance A and its iA counter is increased to 1.
- Next, instance A pushes its total counter to the database, setting its
gcounter to 1 and itsicounter to 0. - Instance B periodically pulls the
gcounter from the database. Now, the new counter is pulled and the instance’s current state isg= 1, iB = 0. - Next, instance A receives one request, and at the same time, instance B receives three requests. At this time instance A knows of 2 requests, 1 of which came since the last flush. Instance B knows of 4 requests, 3 of them came since the last flush.
- Instance B pushes its total counter (3+1=4) to Mongo. As a consequence, its state is set to (4 / 0). Instance A has not yet flushed its counter to persistent storage. Remember that both instances do it independently whenever a fixed interval passes.
- Now, Instance A tries to push its state (1+1=2) to the database. If the push was successful, it would overwrite the state previously written by the instance B (in step 5), resulting in data loss. We want our counters to be precise so we need to use optimistic locking here. It causes the push to fail, if the version of its state differs from the version persisted in the database. If that scenario occurs, the instance knows that it should refresh its global counter before trying to save it again.
- Instance A refreshed its state. It is now equal to (4/1), which means 4 requests are persisted in the database and 1 that has not been flushed yet. Now it can safely push its total counter (4+1=5) to the database and set its state to (5/0).
- At this point both instances have pushed their state to the database. Notice, however, that instance B has not yet pulled the counter written by instance B in the previous step.
- After the last pull, the counter states on both instances are consistent with the database state and reflect the global number of requests made by a client.
Persisting the state #
To properly persist the state in a distributed environment with minimal impact on application performance, we needed to take several strategies into consideration.
Resolving the conflicts #
As we’ve already mentioned we use optimistic locking to prevent the state from being overwritten by the different instances. It’s quite a common problem in a the world of distributed systems. It works by using version numbers kept in MongoDB, which designates how many updates have been made from the beginning of its creation. After each update the version increases by one.
Before save to the database:
{
   "_id" : {...},
   "version" : 0,
   "requestCount": 0,
   ...
}
After the save:
{
   "_id" : {...},
   "version" : 1,
   "requestCount": 5,
   ...
}
But how does a particular instance save the document atomically? How does it know that there was an update made by another instance in the meantime? For this purpose, we use a Mongo query to do the CAS update that looks like:
db.ratelimits.update(
 <filter query>
 <update operation>
)

db.ratelimits.update(
 {
   "_id": {...},
   "version": 1
 },
 {
   "version": 2,
   "requestCount": 10
 }
)
If the query returns 0 elements updated we know there was a collision and there was a concurrent save which changed the state. If this happens we need to:
- Update state from database to local instance,
- Apply inflight recorded changes (the ones not yet persisted to the database),
- Save the state,
- If the query returns 1 element updated, the save was successful without any collisions,
Saving in batches #
As we already mentioned, a single instance of the OAuth server handles many clients. So it has to synchronize the state for each of them. Doing the above save operation for each client individually would cause a massive number of queries and would quickly saturate our resources. That’s why we use Mongo bulk operations. They allow defining many operations in a single query.
Going into production #
Dry-run #
Before actually blocking the clients we needed a way to check real outputs from our solution. We implemented the dry-run mode, which enabled us do this without affecting any clients, while also giving us metrics depicting which of them would be blocked given a particular limit and time window. We took the following steps:
- Set high rate limit up to the point when no clients would be blocked (running in dry-run mode all the time).
- Lowered the threshold to the point that showed us the outstanding clients, while not blocking the others.
- Communicated with clients abusing our future rate limit policy and gave them a chance to optimize the way they use the OAuth server.
- Switched modes from dry-run to actively blocking the clients.
Canary deployment #
It would be risky to deploy this kind of feature to the whole OAuth cluster without ensuring it’s properly working on a few instances. We used canary deployment which allows deploying a version of a service to only a few production instances. During this deployment, we monitored CPU usage and response time metrics. After ensuring there was meaningful disparity we rolled out the full feature to all production instances.
Observability #
To monitor and verify our solution we needed a bunch of metrics telling us how many clients were affected by rate limit policy and which of them are getting closer to being blocked. In practice, two charts shown below were enough to monitor their behaviour:
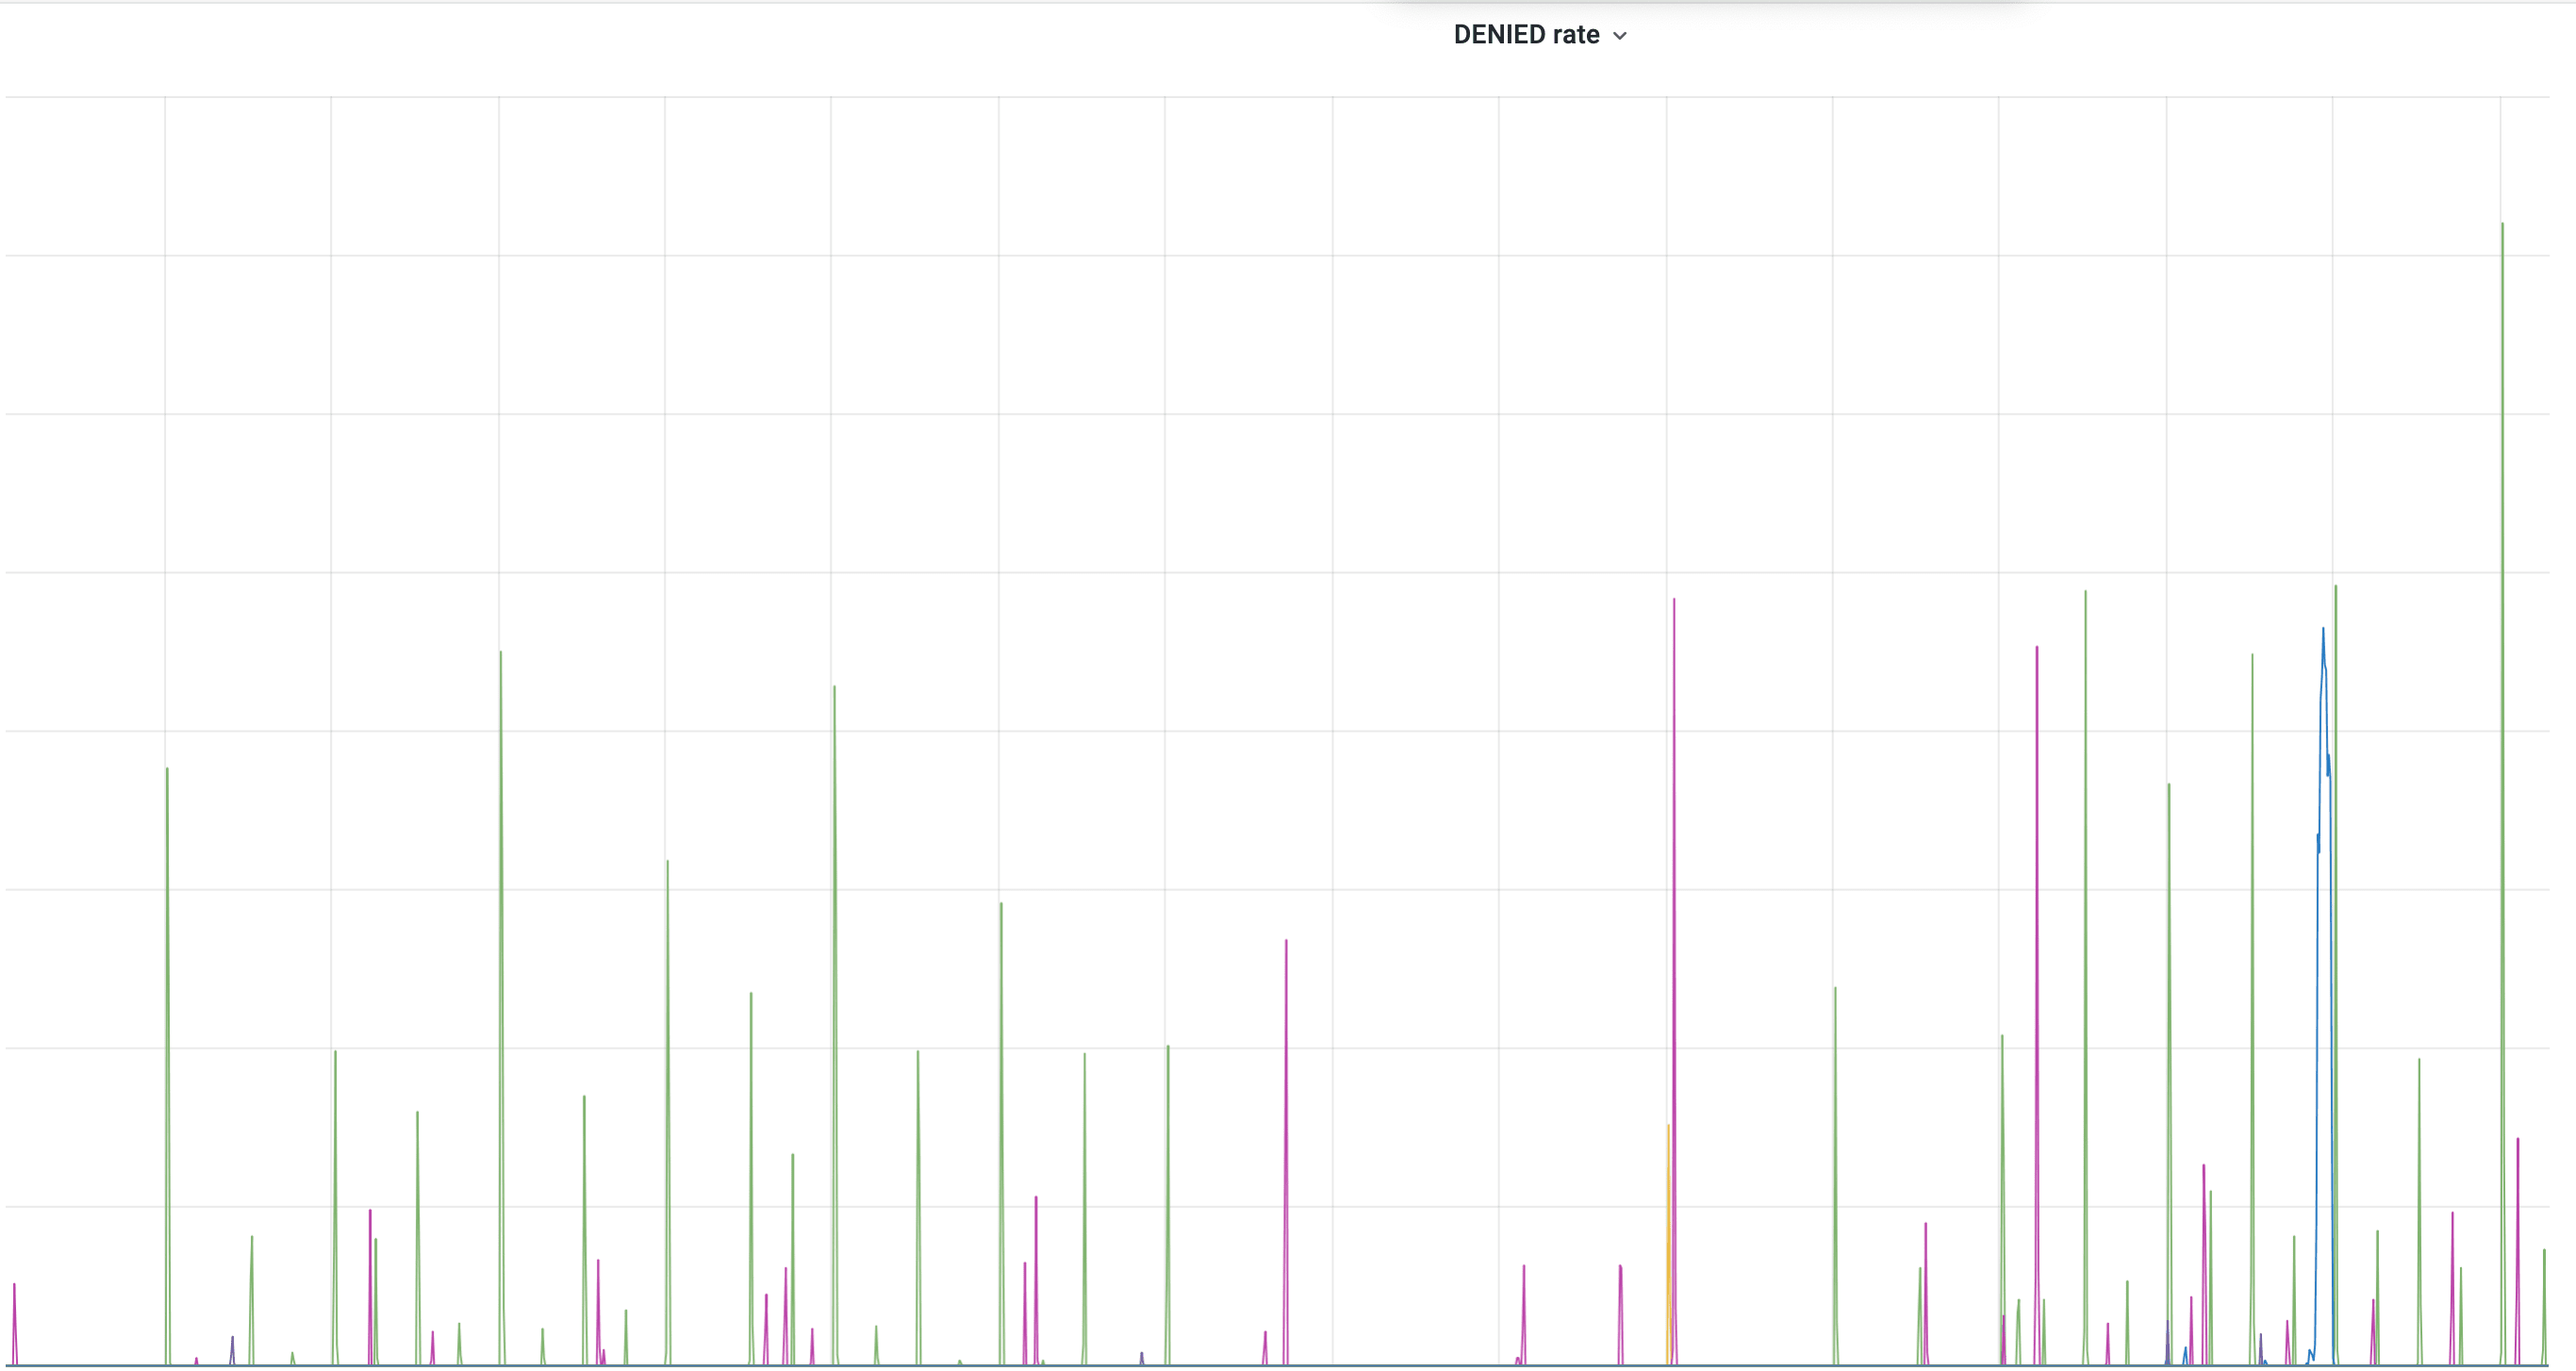
This chart shows clients and their blocked rate. Each color depicts a different blocked client.
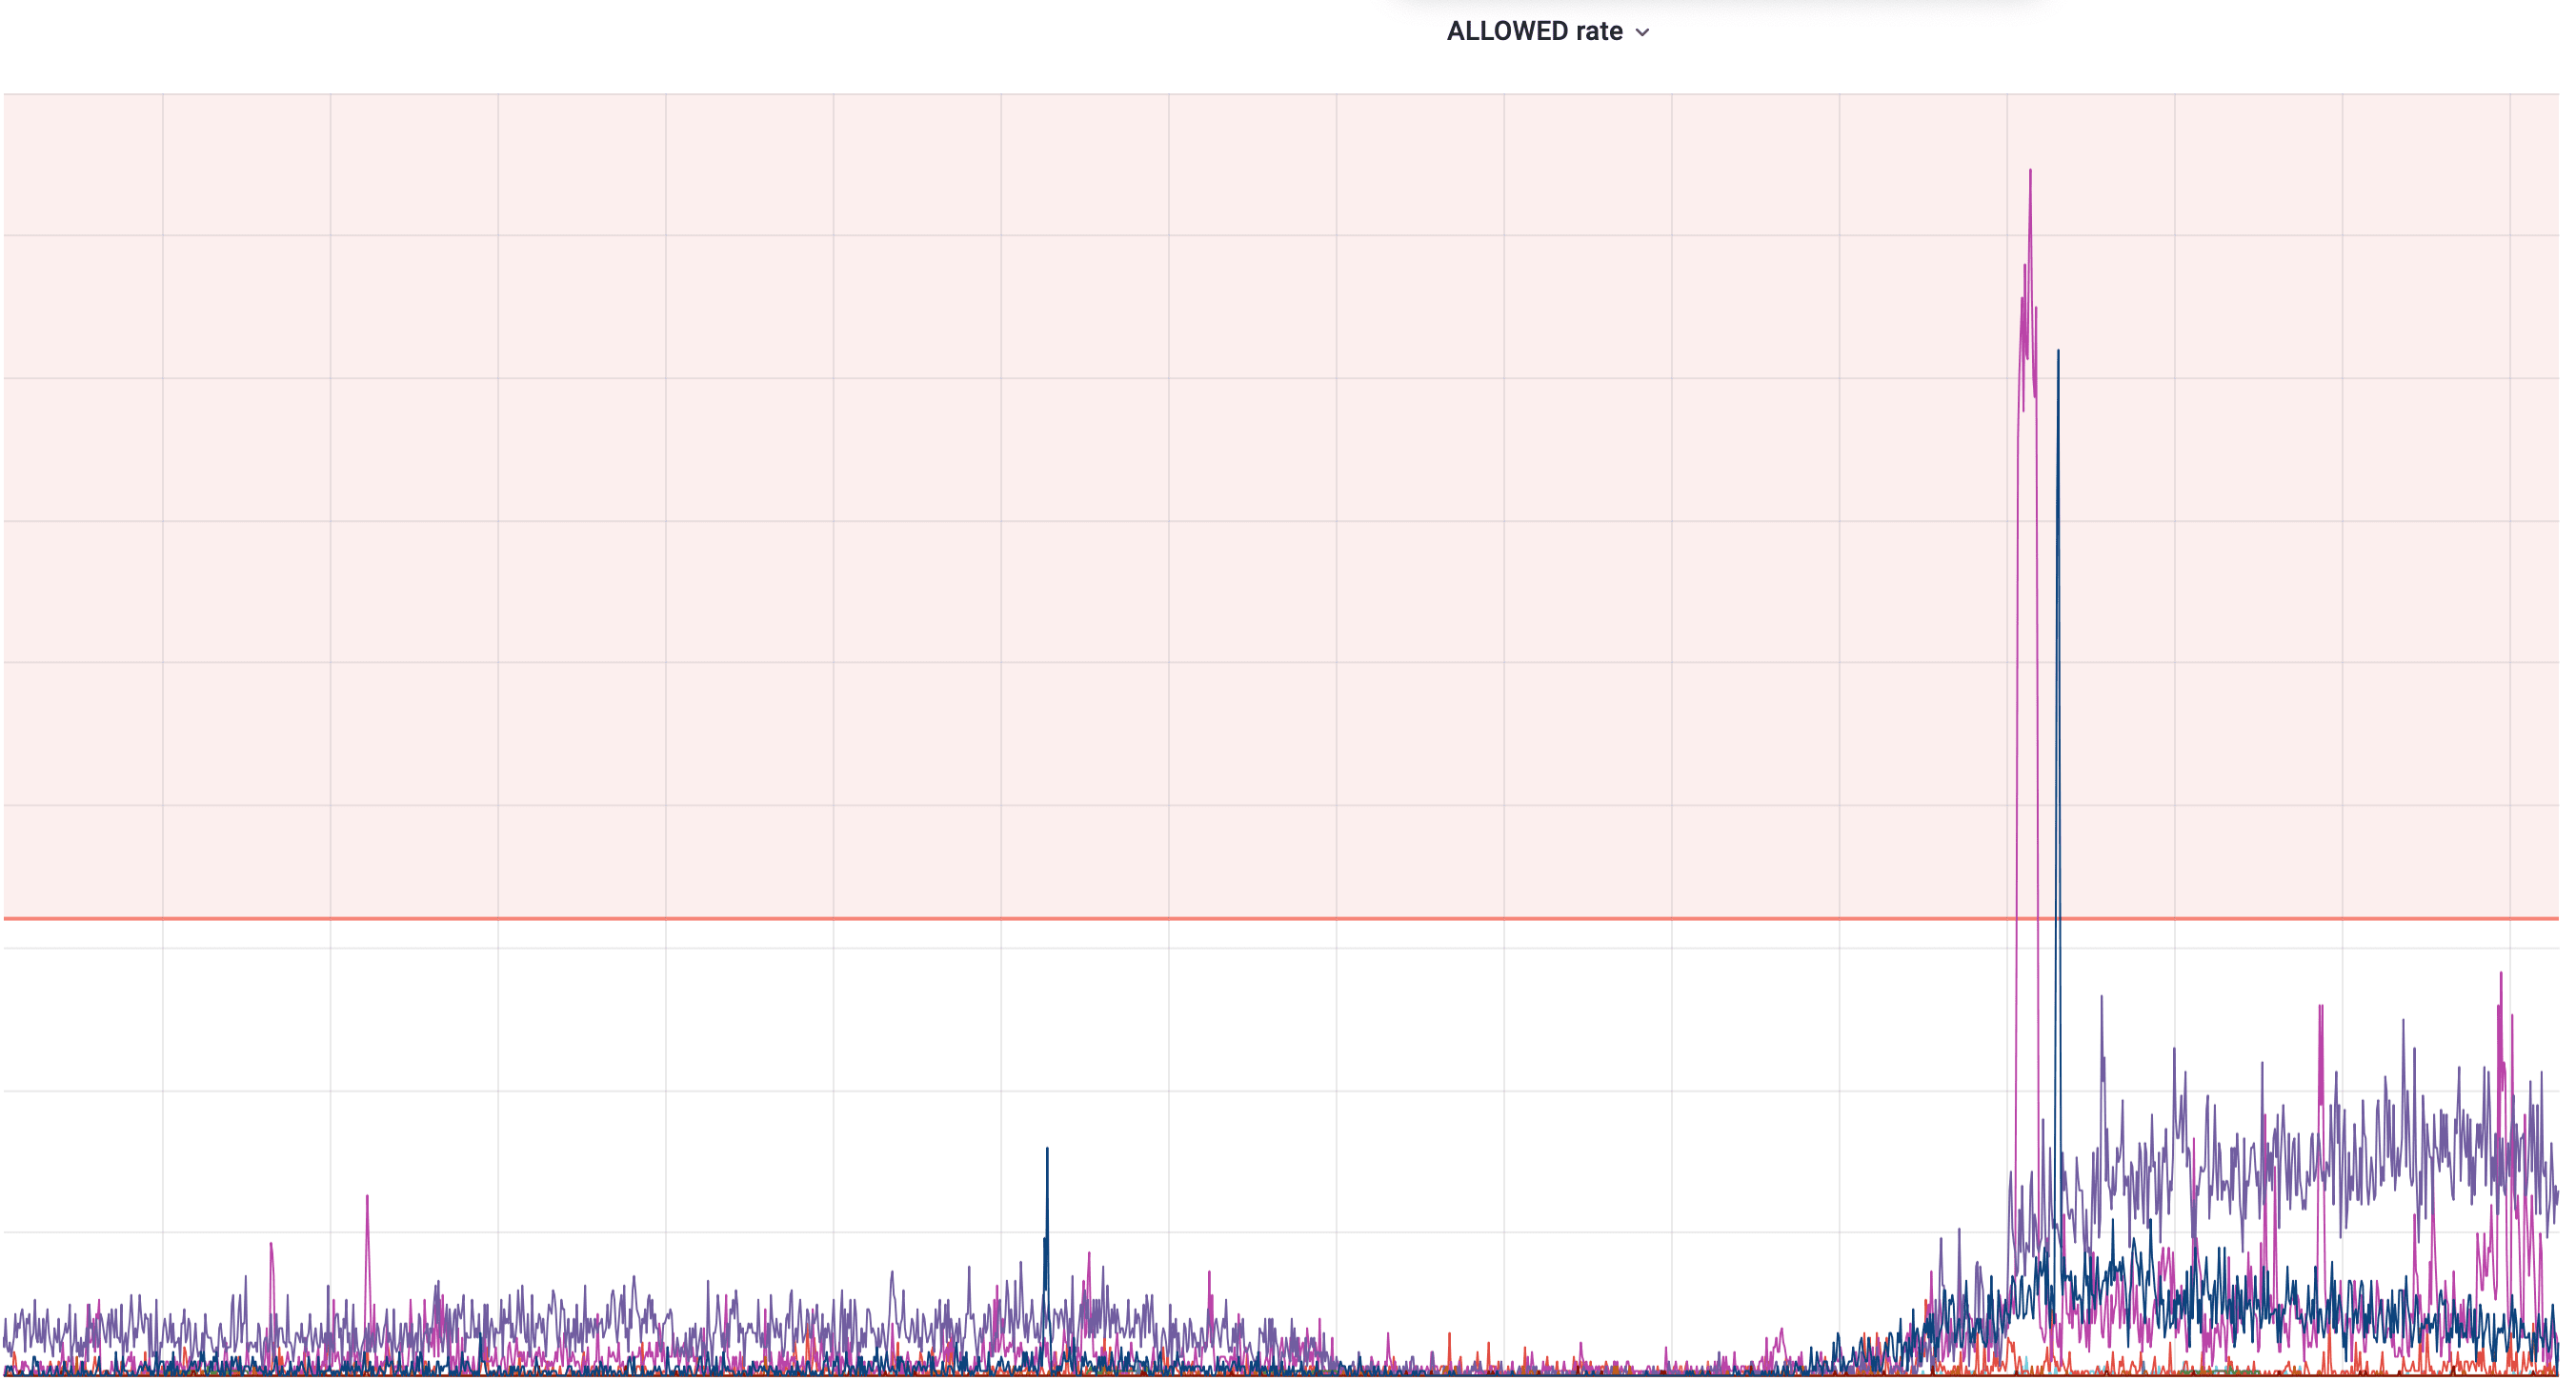
This one on the other hand depicts the allowed rate. The limit line is helpful to see if any client is getting closer to it and will be blocked soon. It’s worth mentioning that the default rate limit policy isn’t sufficient for all of the clients. Some of them require special treatment and for them we can configure different thresholds, which is why a few of them go beyond the actual default limit (the red line).
Conclusion #
Rate-limiting is a common problem, but surprisingly not so trivial to solve, especially in a high-scale, distributed environment. Plenty of popular solutions can be found, but most of them deal with it only from a perspective of a single machine and were not well-suited for our system. Coming up with the above approach took quite a bit of research and planning, but in the end, its deployment allowed us to effectively achieve our goal. We are pretty content with the final product, as it is both effective and fast, but are constantly tweaking it and looking for new ways to optimize that process.