
Scaling Graphite
Switching from monolith to microservices requires a very solid technical ecosystem. One of the most crucial subsystems is monitoring. But for monitoring to work, you need data to monitor. At Allegro, we decided to use Graphite as metrics storage and to build our monitoring ecosystem around tools that integrate with it.
This post is a concrete, technical guide on how to setup a scalable and fault-tolerant Graphite environment in the cloud.
What is Graphite? #
Graphite is a top-level name for a bunch of components that add up to fully functional metrics storage with advanced query language. The architecture is API-oriented with interchangeable elements. Graphite components are:
- graphite-web: end user API and graphical interface, includes powerful query and metric processing language
- carbon-relay: metrics input API, capable of routing metrics between storage hosts
- carbon-cache: persistent store abstraction
- whisper: Round Robin Database-like time series database library
There are other storage implementations that can be used instead of Whisper, but at the time of Graphite deployment at Allegro this was the most stable implementation. We are already experimenting with different stores, but that is outside the scope of this blogpost.
Our scale #
We first deployed Graphite for microservices a year ago, in August 2014. It has been growing rapidly since: during last half a year (from February 2015 till August 2015) we tripled the amount of gathered metrics: from 1,000,000 metrics/minute to 3,000,000 metrics/minute and the demand is still growing.
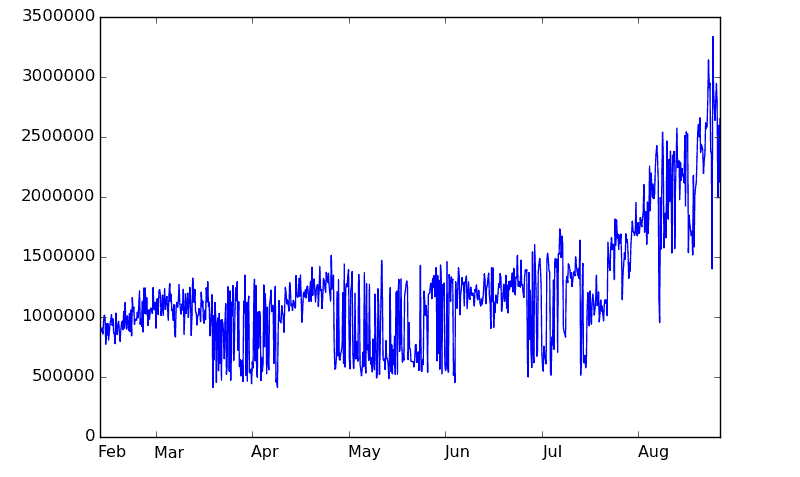
This volume of data came as a surprise at first . In comparison, metrics gathered from our old monolithic application deployed on hundreds of servers reaches 200,000 metrics/minute at most.
Why cloud? #
When we started working with Graphite there was a lot of discussion whether we should invest in baremetal machines or stick with our private OpenStack based cloud. Most of discussions about Graphite on the Internet revolved around performance bottlenecks on some huge metal machines with sick amounts of CPUs and RAM. Since we would hit the wall sooner or later, we decided to create Graphite deployment that would scale horizontally, and cloud seemed like a good (and cheap) place to start.
Architecture #
As our Graphite deployment grew, we experimented with different approaches to architecture. Each of them was suitable at the time and gave us the capacity that we needed. Evolutionary approach meant that we could learn the tools at hand at steady pace and gave us the way to start up quickly. Of course hitting the transition points was bit more stressful, so was handling the clients and data migration. Having that in mind, with team of great engineers it’s better to deliver fast and adopt to the situation as rules of the game change, than to spend months trying to grasp the unknown with plans and estimations only to be surprised by the production traffic.
Getting started #
Graphite “getting started” architecture is pretty solid for a single team/project. Actually, it did quite well for a hundred of microservices pushing 500k metrics/minute. It assumes whole Graphite setup is working on a single machine – relay, cache and the database itself.
Of course, we kept fault tolerance as a priority from the very beginning, thus all the data was written to two hosts. Those two hosts needed to know about each other in order to achieve data duplication (load balancer was just forwarding, not mirroring the traffic).
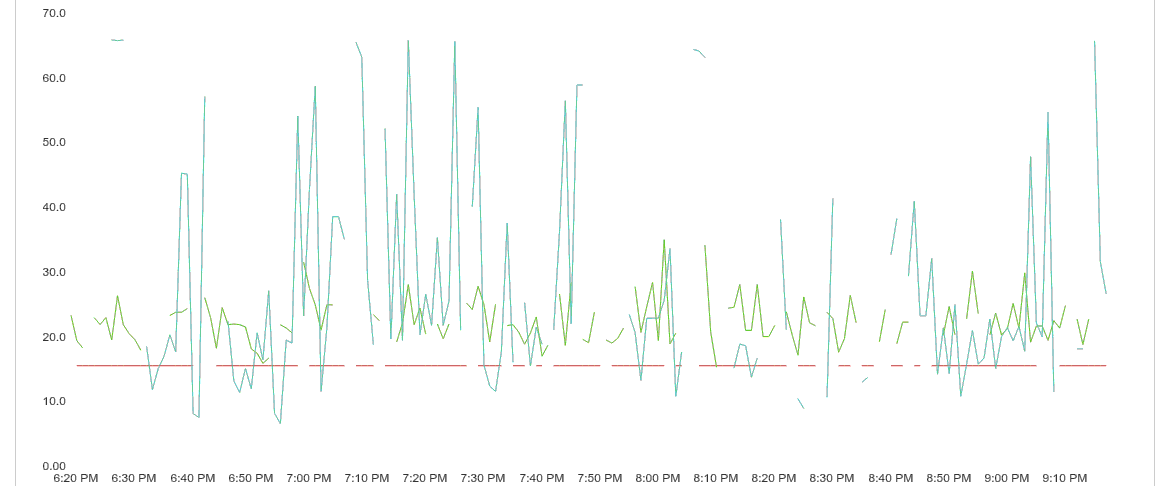
The first signs of problems appeared when clients started reporting spotty graphs for otherwise continuous data.
Quite soon afterwards came the problem with stability – Carbon cache process would crash every few hour’s sending up to an hour worth of data to /dev/null. Why was this happening?
Graphite, as any database system, relies heavily on disk performance. Carbon cache does its best not to let every
request cause write, batching the data before calling whisper updates. If Carbon does not write to disk immediately, it
has to store the data in memory. Unfortunately Carbon configuration allows specifying cache size only in number of
metrics stored, which can not be easily translated to memory used. This, and our fear of losing metrics lead us to
leaving cache size unbounded.
What happens after mixing not-fast-enough HDD disks potentially shared with other applications with unbounded in-memory buffer and page cache at the top of it? Take a look at the image below:
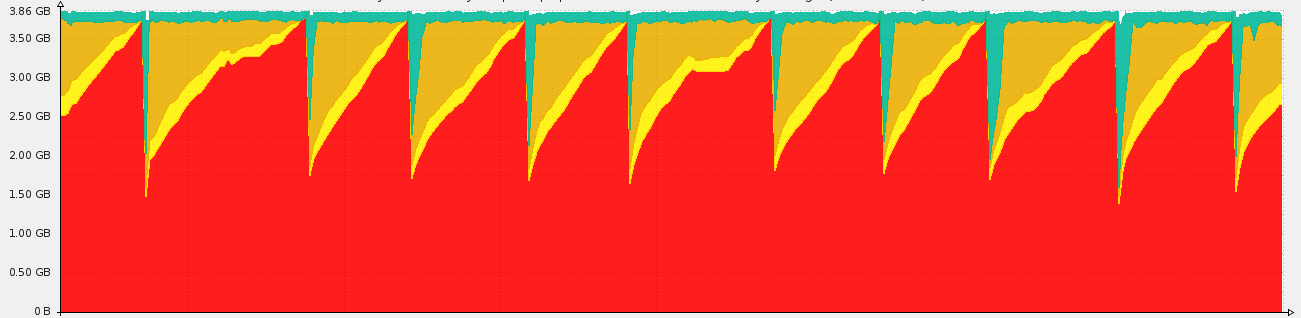
Each drop in memory usage means Carbon process was killed by the Out Of Memory Killer. The volume of incoming metric traffic was too big for the hardware to keep up. When process crashed, the in-memory cache evaporated as well, meaning any metrics that were not written to disk yet got lost as well.
Divide and conquer #
`` At this point we had two options: get better hardware or change the architecture. We actually decided to do both. Each newly spawned host had 8GB of RAM (instead of 4GB) and used SSD drives that became available in our cloud shortly before. The most important and interesting part was the change of architecture.
We decided to split our single Graphite instance into multiple shards, each holding a subset of client metrics. We started
by estimating the traffic that each branch of metrics receives. Since Graphite does not provide any per-branch
metrics, we used two simple tools: du and ncdu to estimate disk usage and how it changes over the time to select
the biggest clients that should eventually be migrated to their own Carbon shards.
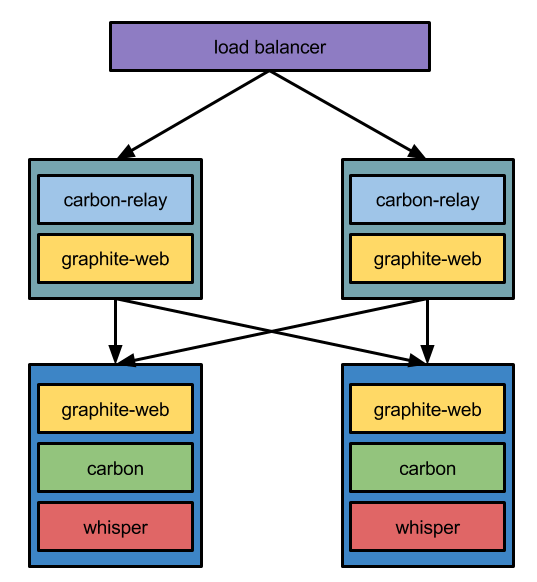
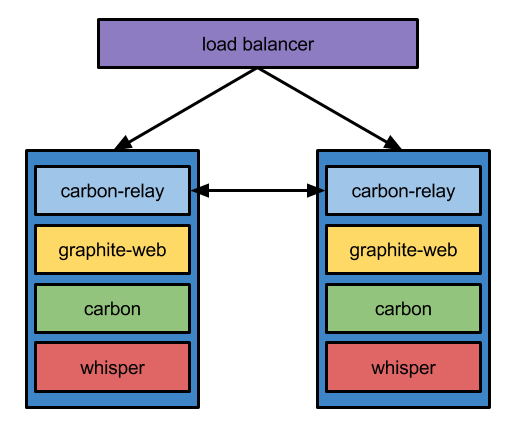
Relay #
Metrics entry point are Relay hosts. They are grouped together under single virtual IP behind a HaProxy load balancer.
Relays run carbon-relay and graphite-web processes. Carbon relay is configured to route metrics to different hosts
based on their path, as can be seen in relay-rules.conf file listed below:
[shard1]
pattern = ^stats\.shard1\..+
#              stats-101         stats-201
destinations = 192.168.0.1:2004, 192.168.0.2:2004

[shard2]
pattern = ^stats\.shard2\..+
#              stats-102         stats-202
destinations = 192.168.0.3:2004, 192.168.0.4:2004

[default]
default = true
#              stats-100          stats-200
destinations = 192.168.0.10:2004, 192.168.0.11:2004
In order to make this setup work, destination hosts need to be listed in carbon.conf as well:
DESTINATIONS = 192.168.0.1:2004, 192.168.0.2:2004,
    192.168.0.3:2004, 192.168.0.4:2004,
    192.168.0.10:2004, 192.168.0.11:2004
On the reading side, graphite-web needs to be configured so it knows where are all the shards that should be queried
for metrics. This can be done in local_settings.py:
CLUSTER_SERVERS = [
    "192.168.0.1:80", "192.168.0.2:80",
    "192.168.0.3:80", "192.168.0.4:80",
    "192.168.0.10:80", "192.168.0.11:80"
]
The order of servers does matter. graphite-web sends requests to all of them and first query that returns a match is
used. Thus if you happen to have same metrics on two shards (i.e. during migration period) it’s good practice to put
the old host after the preferred one.
Cache #
Hosts which actually hold the metrics run carbon-cache and graphite-web processes. Their configuration is very simple
though. None of them needs to know about any other nodes in cluster. Cache nodes know only about themselves and metrics
they hold. Whole coordination effort relies on relay hosts. The only thing that might be customizable are storage
patterns (data resolution and retention time) kept in storage-schemas.conf.
Current state #
We have been able to scale our Graphite cluster horizontally for the past few months using this sharded architecture. Currently we hit 3mln metrics/minute mark on 10 shards and the volume is still growing. Single node in cluster should not accept more than 600k – 700k metrics/minute, as beyond this point data tends to get corrupted or lost. Of course these numbers apply to our cloud infrastructure, so your mileage will vary.
Limitations #
Although scalable, this approach is not ideal: the biggest issue is query response time. This comes as a result of
graphite-web remote query algorithm. Note that in sharded architecture every single query gets translated to remote
query. Since graphite-web does not know which cache node to ask, it sends queries to all of them,
gathering results and choosing the most suitable ones. In our architecture this has two implications.
First of all, adding more nodes will increase response time a bit. Only a pair of hosts holds data necessary to create a response, but fortunately local query on host that do not have matching data is fast.
Second issue is much worse. Any malfunction of any cache node has a devastating effect on overall query performance.
This is because each query will wait for request to bad cache to timeout. In our case, average response time increases
from 0.5 second to 3+ seconds. Not only clients have to wait much longer, but graphite-web threads are blocked and some of
the clients might experience connection timeouts. Since graphite has no tools that would allow dynamic change in
configuration, reboot of all relay hosts is needed to exclude malfunctioning host from cluster until it gets repaired.
Future #
Having Graphite as a working metric store, we are looking towards some other solutions, especially those supporting Metrics 2.0. For now, we are routing existing metrics from Graphite to KairosDB to get better fault tolerance and recovery, since copying and merging Whisper files over the network is a very tedious way to recover after single node failure.