A comedy of errors. Debugging Java memory leaks.
We all make errors, but some errors seem so ridiculous we wonder how anyone, let alone we ourselves, could have done such a thing. This is, of course, easy to notice only after the fact. Below, I describe a series of such errors which we recently made in one of our applications. What makes it interesting is that initial symptoms indicated a completely different kind of problem than the one actually present.
Once upon a midnight dreary
I was woken up shortly after midnight by an alert from our monitoring system. Adventory, an application responsible for indexing ads in our PPC (pay-per-click) advertising system had apparently restarted several times in a row. In a cloud environment, a restart of one single instance is a normal event and does not trigger any alerts, but this time the threshold had been exceeded by multiple instances restarting within a short period. I switched on my laptop and dived into the application’s logs.
It must be the network
I saw several timeouts as the service attempted connecting to ZooKeeper. We use ZooKeeper (ZK) to coordinate indexing between multiple instances and rely on it to be robust. Clearly, a Zookeeper failure would prevent indexing from succeeding, but it shouldn’t cause the whole app to die. Still, this was such a rare situation (the first time I ever saw ZK go down in production) that I thought maybe we had indeed failed to handle this case gracefully. I woke up the on-duty person responsible for ZooKeeper and asked them to check what was going on.
Meanwhile, I checked our configuration and realized that timeouts for ZooKeeper connections were in the multi-second range. Obviously, ZooKeeper was completely dead, and given that other applications were also using it, this meant serious trouble. I sent messages to a few more teams who were apparently not aware of the issue yet.
My colleague from ZooKeeper team got back to me, saying that everything looked perfectly normal from his point of view. Since other users seemed unaffected, I slowly realized ZooKeeper was not to blame. Logs clearly showed network timeouts, so I woke up the people responsible for networking.
Networking team checked their metrics but found nothing of interest. While it is possible for a single segment of the network or even a single rack to get cut off from the rest, they checked the particular hosts on which my app instances were running and found no issues. I had checked a few side ideas in the meantime but none worked, and I was at my wit’s end. It was getting really late (or rather early) and, independently from my actions, restarts somehow became less frequent. Since this app only affected the freshness of data but not its availability, together with all involved we decided to let the issue wait until morning.
It must be garbage collection
Sometimes it is a good idea to sleep on it and get back to a tough problem with a fresh mind. Nobody understood what was going on and the service behaved in a really magical way. Then it dawned on me. What is the main source of magic in Java applications? Garbage collection of course.
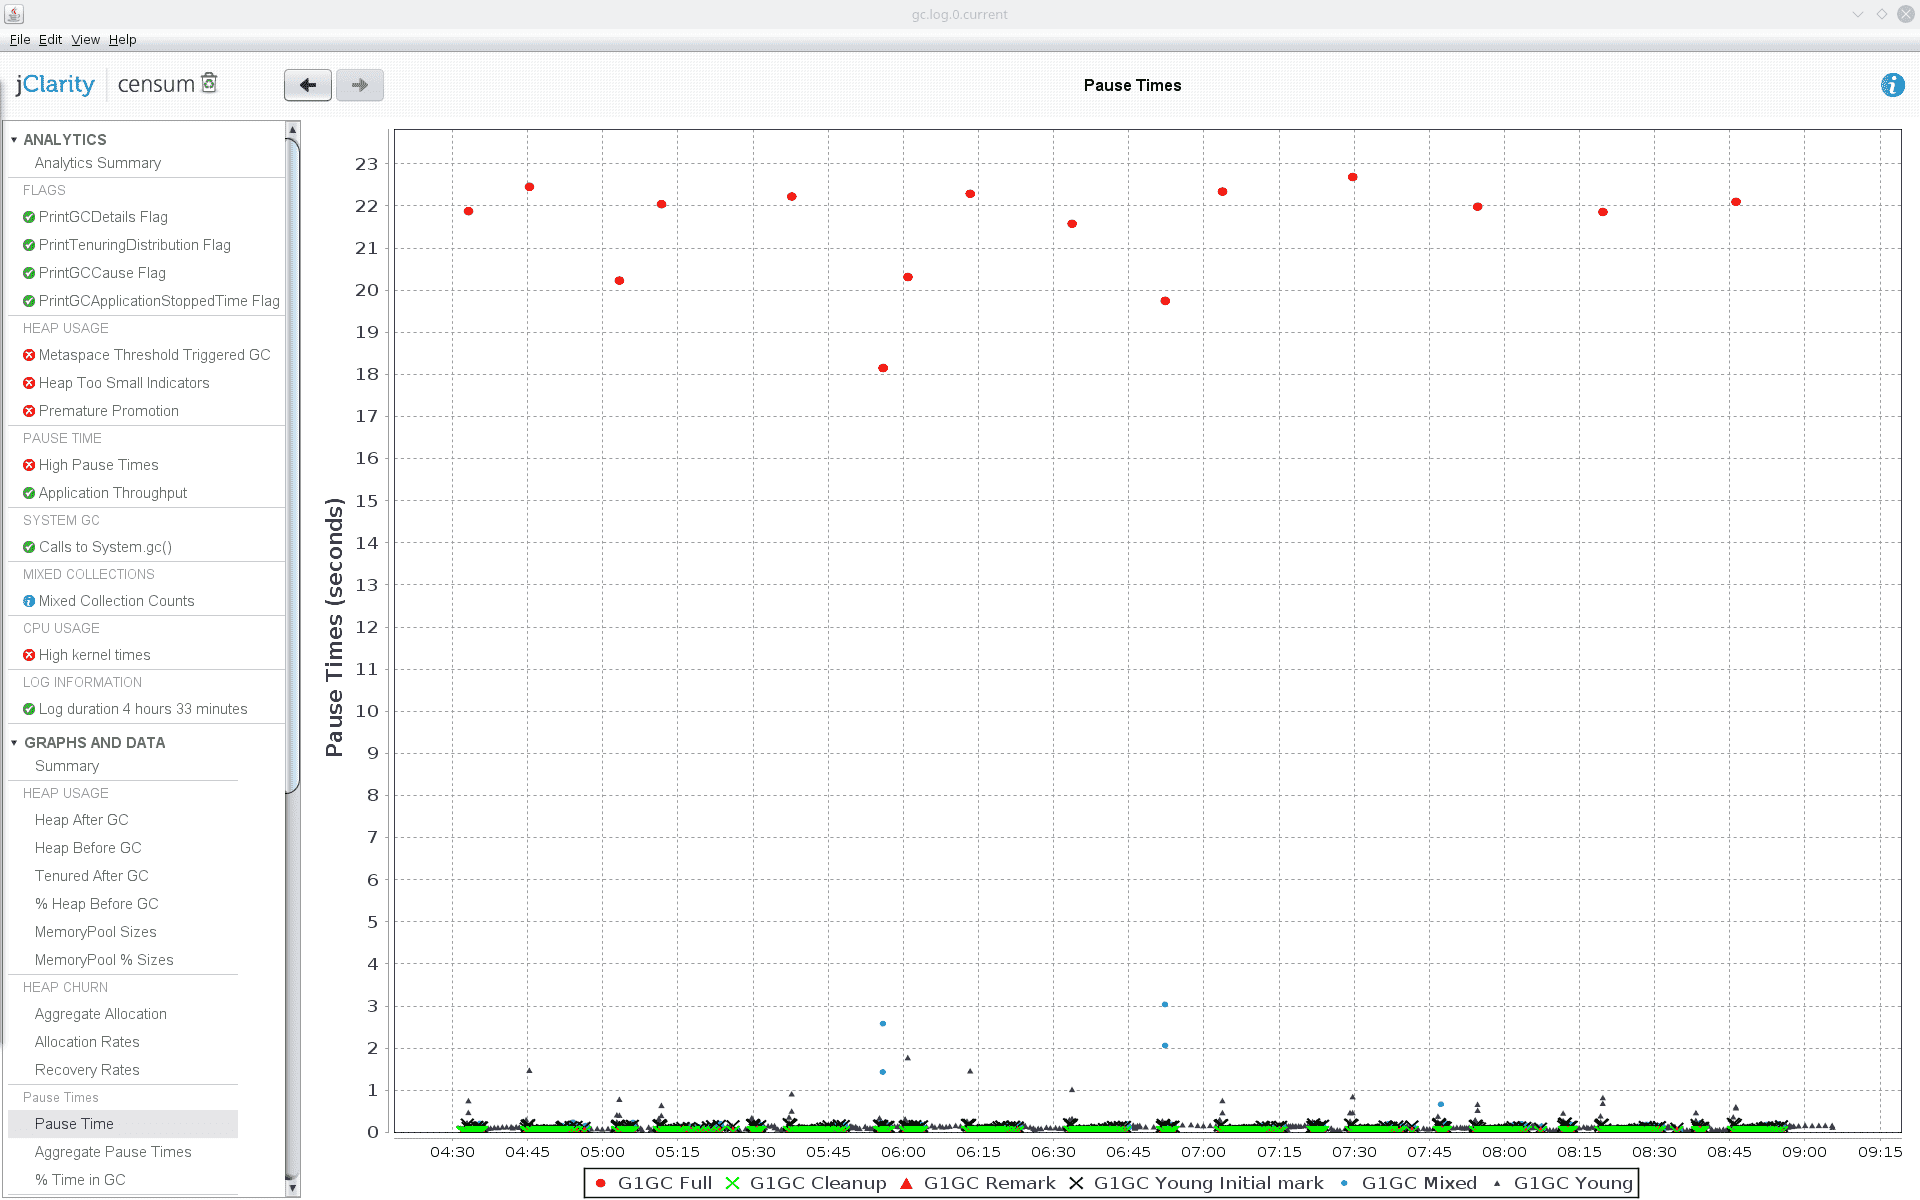
Just for cases like this, we keep GC logging on by default. I quickly downloaded the GC log and fired up Censum. Before my very eyes, a grisly sight opened: full garbage collections happening once every 15 minutes and causing 20-second long [!] stop-the-world pauses. No wonder the connection to ZooKeeper was timing out despite no issues with either ZooKeeper or the network!
These pauses also explained why the whole application kept dying rather than just timing out and logging an error. Our apps run inside Marathon, which regularly polls a healthcheck endpoint of each instance and if the endpoint isn’t responding within reasonable time, Marathon restarts that instance.
Knowing the cause of a problem is half the battle, so I was very confident that the issue would be solved in no time. In order to explain my further reasoning, I have to say a bit more about how Adventory works, for it is not your standard microservice.
Adventory is used for indexing our ads into ElasticSearch (ES). There are two sides to this story. One is acquiring the necessary data. To this end, the app receives events sent from several other parts of the system via Hermes. The data is saved to MongoDB collections. The traffic is a few hundred requests per second at most, and each operation is rather lightweight, so even though it certainly causes some memory allocation, it doesn’t require lots of resources. The other side of the story is indexing itself. This process is started periodically (around once every two minutes) and causes data from all the different MongoDB collections to be streamed using RxJava, combined into denormalized records, and sent to ElasticSearch. This part of the application resembles an offline batch processing job more than a service.
During each run, the whole index is rebuilt since there are usually so many changes to the data that incremental indexing is not worth the fuss. This means that a whole lot of data has to pass through the system and that a lot of memory allocation takes place, forcing us to use a heap as large as 12 GB despite using streams. Due to the large heap (and to being the one which is currently fully supported), our GC of choice was G1.
Having previously worked with some applications which allocate a lot of short-lived objects, I increased the size of young generation
by increasing both -XX:G1NewSizePercent and -XX:G1MaxNewSizePercent from their default values so that more data could be handled
by the young GC rather than being moved to old generation, as Censum showed a lot of premature tenuring. This was also consistent
with the full GC collections taking place after some time. Unfortunately, these settings didn’t help one bit.
The next thing I thought was that perhaps the producer generated data too fast for the consumer to consume, thus causing records to be allocated faster than they could be freed. I tried to reduce the speed at which data was produced by the repository by decreasing the size of a thread pool responsible for generating the denormalized records while keeping the size of the consumer data pool which sent them off to ES unchanged. This was a primitive attempt at applying backpressure, but it didn’t help either.
It must be a memory leak
At this point, a colleague who had kept a cooler head, suggested we do what we should have done in the first place, which is to look at
what data we actually had in the heap. We set up a development instance with an amount of data comparable to the one in production
and a proportionally scaled heap. By connecting to it with jvisualvm and running the memory sampler, we could see the approximate
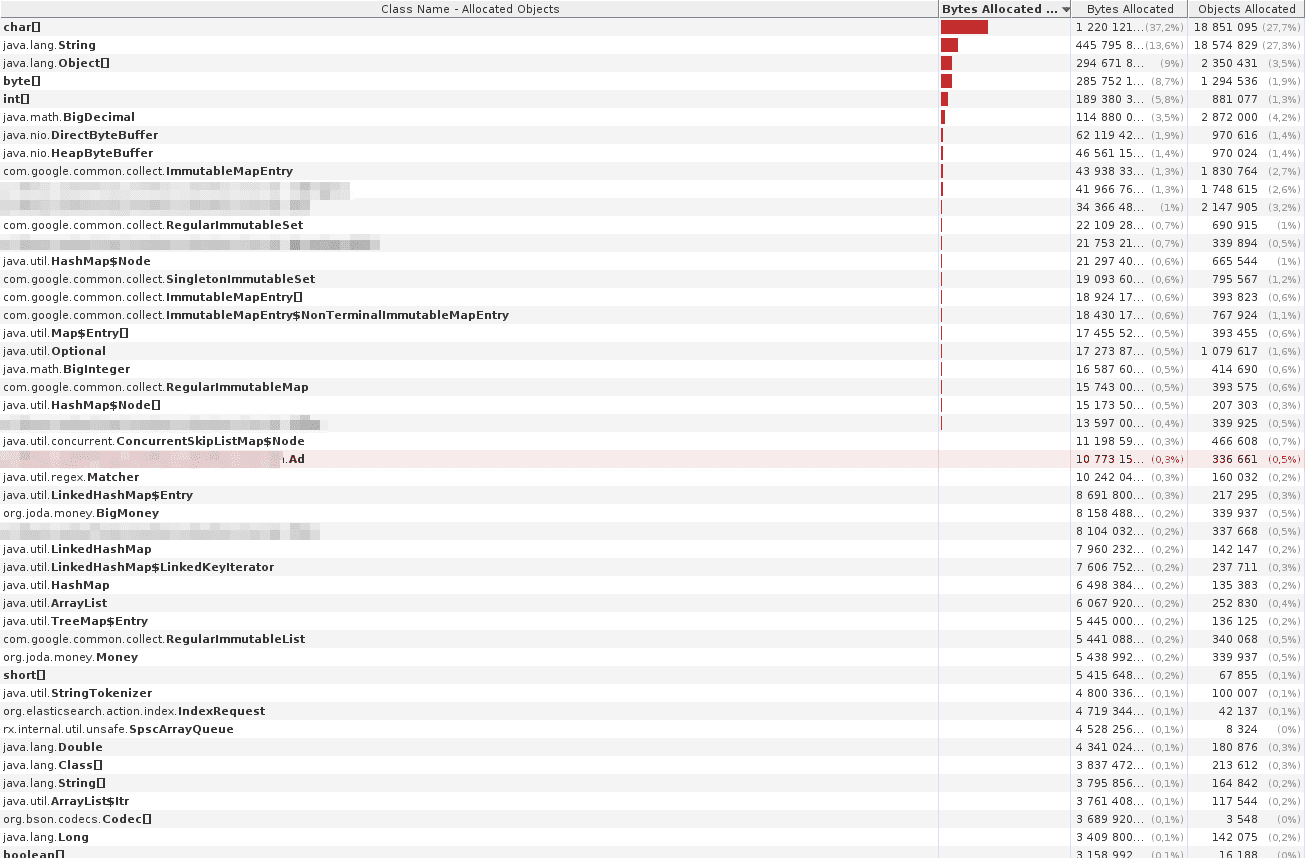
counts and sizes of objects in the heap. A quick look revealed that the number of our domain Ad objects was way larger than it should be
and kept growing all the time during indexing, up to a number which bore a striking resemblance to the number of ads we were processing.
But… this couldn’t be. After all, we were streaming the records using RX exactly for this reason: in order to avoid loading all of the data into memory.
With growing suspicion, I inspected the code, which had been written about two years before and never seriously revisited since.
Lo and behold, we were actually loading all data into memory. It was, of course not intended. Not knowing RxJava well enough at that
time, we wanted to parallelize the code in a particular way and resolved to using CompletableFuture along with a separate executor
in order to offload some work from the main RX flow. But then, we had to wait for all the CompletableFutures to complete… by storing
references to them and calling join(). This caused the references to all futures, and thus also to all the data they referenced,
to be kept alive until the end of indexing, and prevented the Garbage Collector from freeing them up earlier.
Is it really so bad?
This is obviously a stupid mistake, and we were quite disgusted at finding it so late. I even remembered a brief discussion a long time earlier about the app needing a 12 GB heap, which seemed a bit much. But on the other hand, this code had worked for almost two years without any issues. We were able to fix it with relative ease at this point while it would probably have taken us much more time if we tried fixing it two years before and at that time there was a lot of work much more important for the project than saving a few gigabytes of memory.
So while on a purely technical level having this issue for such a long time was a real shame, from a strategic point of view maybe leaving it alone despite the suspected inefficiency was the pragmatically wiser choice. Of course, yet another consideration was the impact of the problem once it came into light. We got away with almost no impact for the users, but it could have been worse. Software engineering is all about trade-offs, and deciding on the priorities of different tasks is no exception.
Still not working
Having more RX experience under our belt, we were able to quite easily get rid of the CompletableFutures, rewrite the code to use only RX,
migrate to RX2 in the process, and to actually stream the data instead of collecting it in memory. The change passed code review
and went to testing in dev environment. To our surprise, the app was still not able to perform indexing with a smaller heap.
Memory sampling revealed that the number of ads kept in memory was smaller than previously and it not only grew but sometimes also
decreased, so it was not all collected in memory. Still, it seemed as if the data was not being streamed, either.
So what is it now?
The relevant keyword was already used in this post: backpressure. When data is streamed, it is common for the speeds of the producer and the consumer to differ. If the producer is faster than the consumer and nothing forces it to slow down, it will keep producing more and more data which can not be consumed just as fast. There will appear a growing buffer of outstanding records waiting for consumption and this is exactly what happened in our application. Backpressure is the mechanism which allows a slow consumer to tell the fast producer to slow down.
Our indexing stream had no notion of backpressure which was not a problem as long as we were storing the whole index in memory anyway. Once we fixed one problem and started to actually stream the data, another problem — the lack of backpressure — became apparent.
This is a pattern I have seen multiple times when dealing with performance issues: fixing one problem reveals another which you were not even aware of because the other issue hid it from view. You may not be aware your house has a fire safety issue if it is regularly getting flooded.
Fixing the fix
In RxJava 2, the original Observable class was split into Observable which does not support backpressure and Flowable which does.
Fortunately, there are some neat ways of creating Flowables which give them backpressure support out-of-the-box. This includes creating
Flowables from non-reactive sources such as Iterables. Combining such Flowables results in Flowables which also support
backpressure, so fixing just one spot quickly gave the whole stream backpressure support.
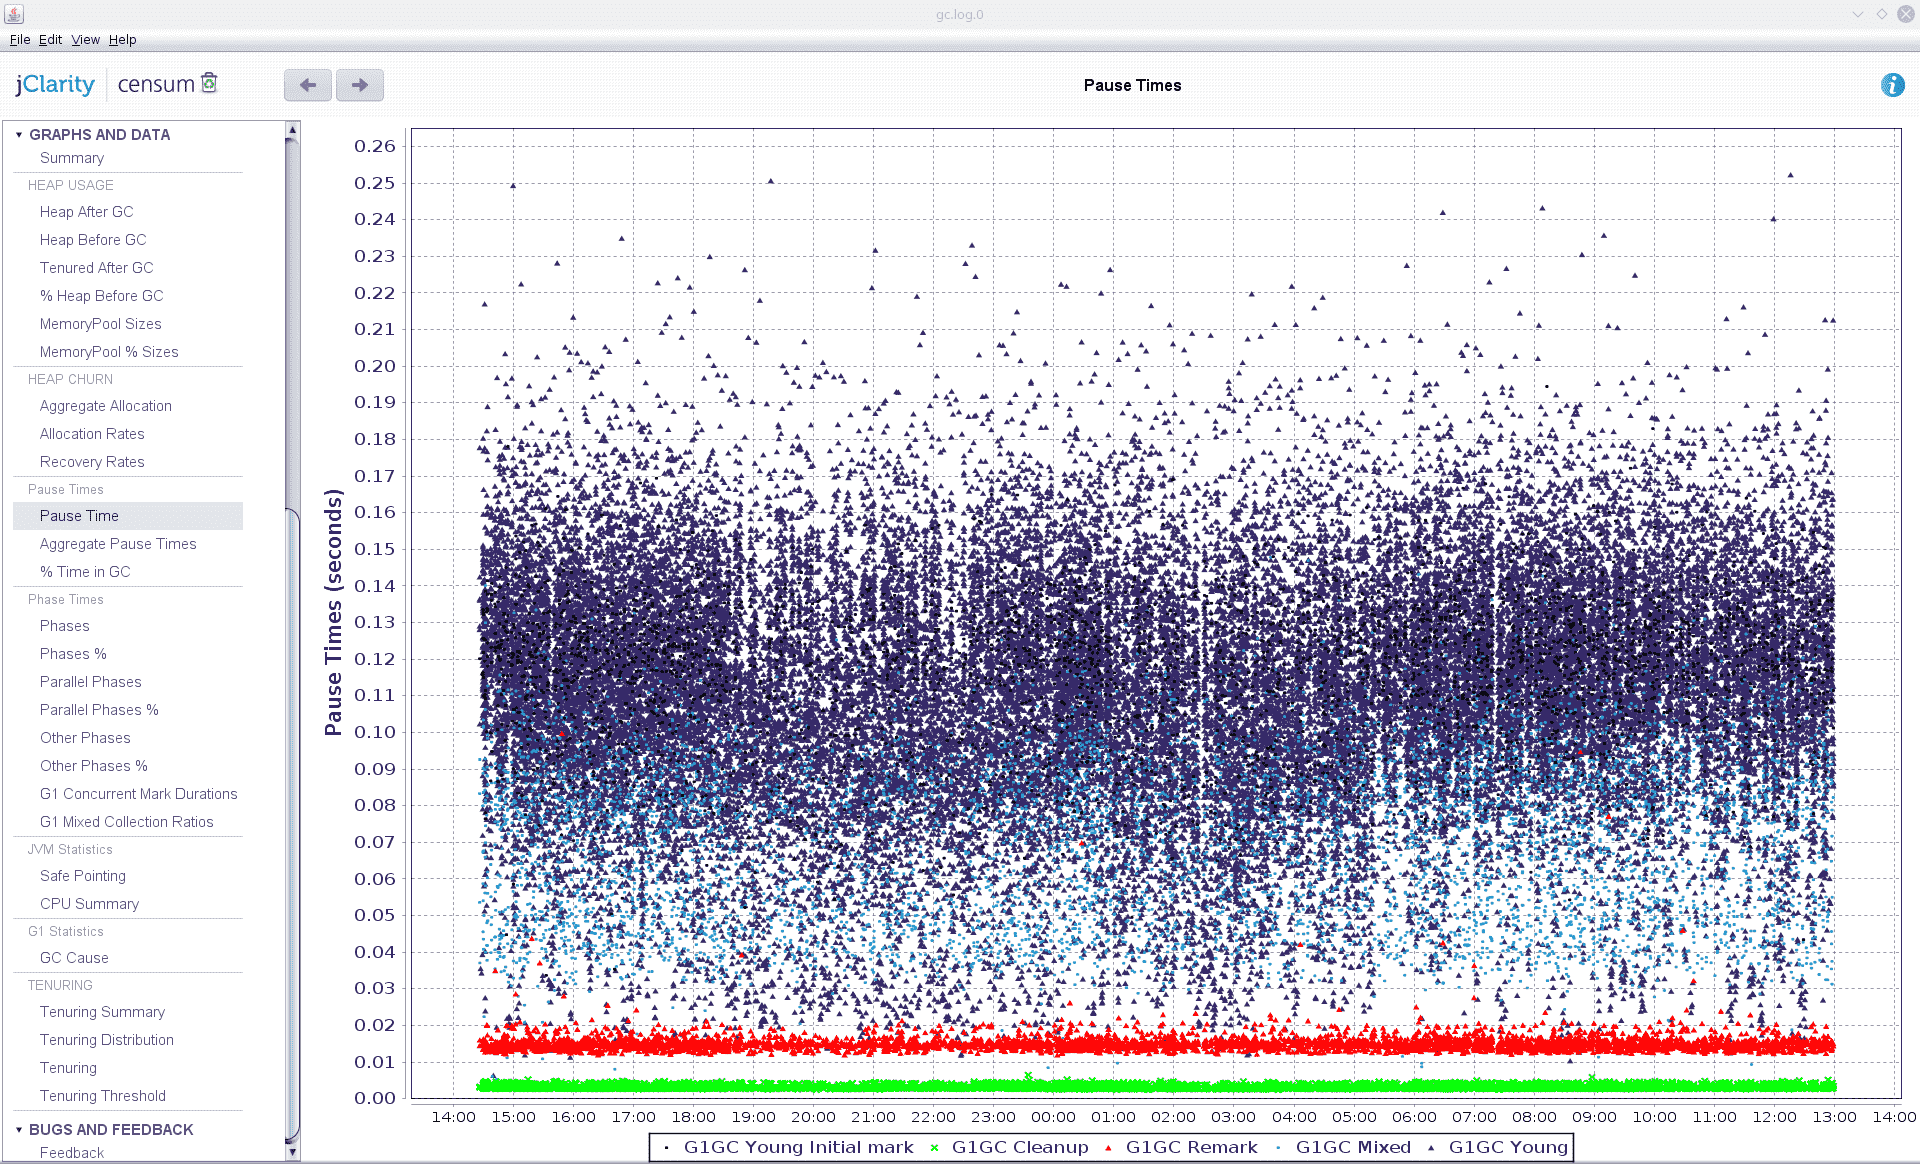
With this change in place, we were able to reduce the heap from 12 GB to 3 GB and still have the app do its job just as fast as before. We still got a single full GC with a pause of roughly 2 seconds once every few hours, but this was already much better than the 20 second pauses (and crashes) we saw before.
GC tuning again
However, the story was not over yet. Looking at GC logs, we still noticed lots of premature tenuring — on the order of 70%. Even though performance was already acceptable, we tried to get rid of this effect, hoping to perhaps also prevent the full garbage collection at the same time.
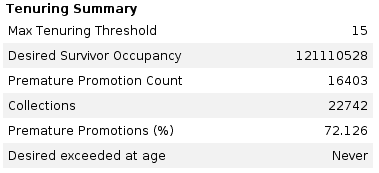
Premature tenuring (also known as premature promotion) happens when an object is short-lived but gets promoted to the old (tenured) generation anyway. Such objects may affect GC performance since they stuff up the old generation which is usually much larger and uses different GC algorithms than new generation. Therefore, premature promotion is something we want to avoid.
We knew our app would produce lots of short-lived objects during indexing, so some premature promotion was no surprise, but its
extent was. The first thing that comes to mind when dealing with an app that creates lots of short-lived objects is to simply
increase the size of young generation. By default, G1GC can adjust the size of generations automatically, allowing for between
5% and 60% of the heap to be used by the new generation. I noticed that in the live app proportions of young and old generations changed
all the time over a very wide range of proportions, but still went ahead and checked what would happen
if I raised both bounds: -XX:G1NewSizePercent=40 and -XX:G1MaxNewSizePercent=90. This did not help, and it actually made matters much worse,
triggering full GCs almost immediately after the app started. I tried some other ratios, but the best I could arrive at was only
increasing G1MaxNewSizePercent without modifying the minimum value: it worked about as well as defaults but not better.
After trying a few other options, with as little success as in my first attempt, I gave up and e-mailed Kirk Pepperdine
who is a renowned expert in Java performance and whom I had the opportunity to meet at Devoxx conference and during training sessions at
Allegro. After viewing GC logs and exchanging a few e-mails, Kirk suggested an experiment which was to set
-XX:G1MixedGCLiveThresholdPercent=100. This setting should force G1GC mixed collections to clean all old regions regardless of how
much they were filled up, and thus to also remove any objects prematurely tenured from young. This should prevent old generation from filling
up and causing a full GC at any point. However, we were again surprised to get a full garbage collection run after some time.
Kirk concluded that this behavior, which he had seen earlier in other applications, was a bug in G1GC: the mixed collections were apparently not
able to clean up all garbage and thus allowed it to accumulate until full GC. He said he had contacted Oracle about it but they claimed
this was not a bug and the behavior we observed was correct.
Conclusion
What we ended up doing was just increasing the app’s heap size a bit (from 3 to 4 GB), and full garbage collections went away. We still see a lot of premature tenuring but since performance is OK now, we don’t care so much any more. One option we could try would be switching to CMS (Concurrent Mark Sweep) GC, but since it is deprecated by now, we’d rather avoid using it if possible.
So what is the moral of the story? First, performance issues can easily lead you astray. What at first seemed to be a ZooKeeper or network issue, turned out to be an error in our own code. Even after realizing this, the first steps I undertook were not well thought out. I started tuning garbage collection in order to avoid full GC before checking in detail what was really going on. This is a common trap, so beware: even if you have an intuition of what to do, check your facts and check them again in order to not waste time solving a problem different from the one you are actually dealing with.
Second, getting performance right is really hard. Our code had good test coverage and feature-wise worked perfectly, but failed to meet performance requirements which were not clearly defined at the beginning and which did not surface until long after deployment. Since it is usually very hard to faithfully reproduce your production environment, you will often be forced to test performance in production, regardless of how bad that sounds.
Third, fixing one issue may allow another, latent one, to surface, and force you to keep digging in for much longer than you expected. The fact that we had no backpressure was enough to break the app, but it didn’t become visible before we had fixed the memory leak.
I hope you find this funny experience of ours helpful when debugging your own performance issues!